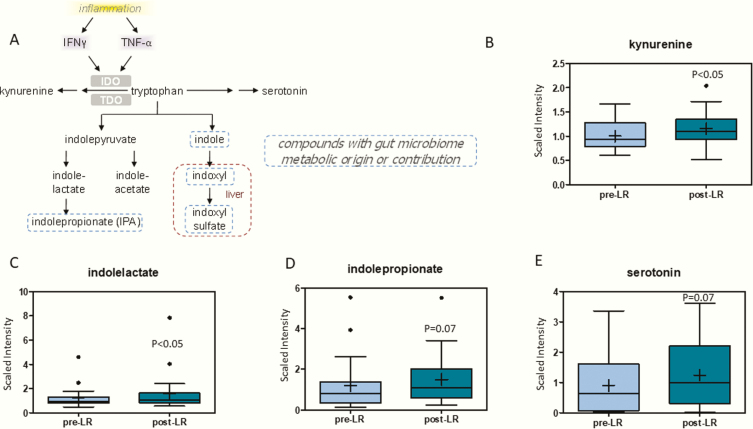
Figure 3.
(A) Pathway of tryptophan degradation. Products of tryptophan degradation (B) kynurenine, (C) indolelactate, (D) indolepropionate, and (E) serotonin are increased following leptin therapy. The X-axis shows the before and after leptin replacement (LR) and the Y-axis shows the relative scaled intensity for the metzabolites measured. Within the boxplot, the mean value is represented by the plus sign, the median by the horizontal dividing line, and the top and bottom of the box represent the 75th and 25th percentile, with the whiskers indicating the maximum and minimum points and outlier points shown as filled circles.

