Figure 3.
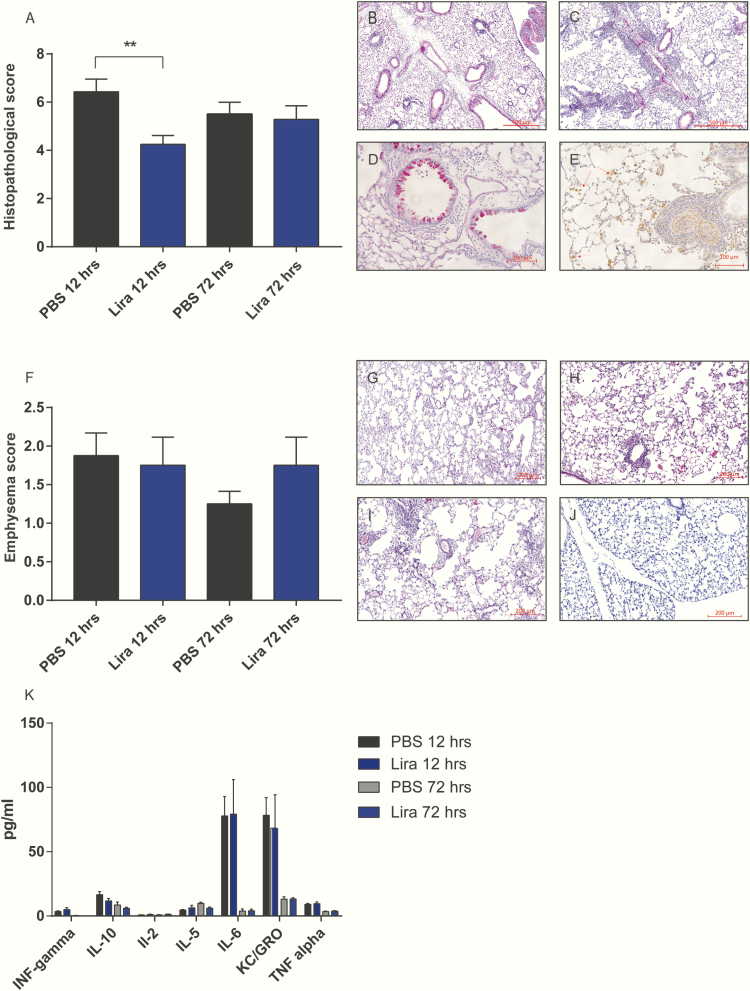
Effect of liraglutide on histopathology and inflammatory markers in COPD. A, Bar graph of histopathological score in the different groups. H&E staining showing B, perivascular edema; C, perivascular/peribronchial acute inflammation; D, goblet cell metaplasia of the bronchioles; and E, macrophages/mononuclear cells in the alveolar spaces. F, Emphysema score. Examples of emphysema scored as G, mild; H, moderate; I, and severe. J, Healthy mouse lung for comparison. K, Measurements of proinflammatory cytokines in plasma from COPD mice. Comparisons were carried out between lira 12-h and PBS 12-h, lira 72 h and PBS 72 h. Data are shown as means ± SEM, n = 32. Statistics were analyzed by 1-way ANOVA followed by Bonferroni post hoc test. **P < .01.

