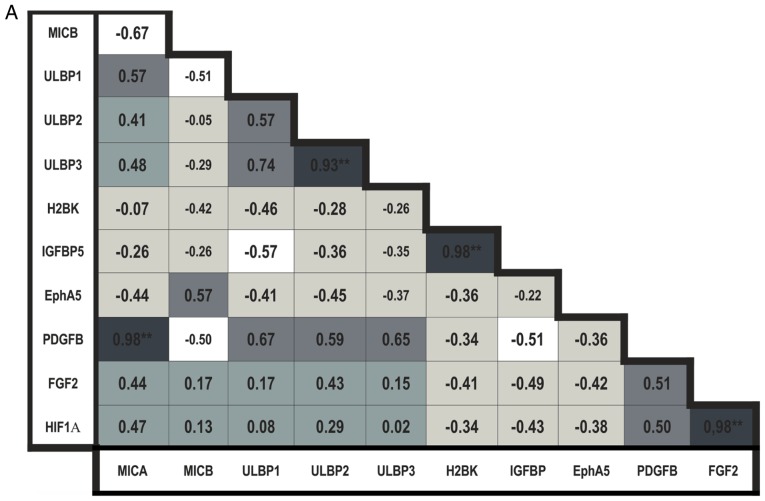
Figure 6.
Bravais-Pearson correlation analysis. (A) Correlation analysis in the cerebral metastasis tissues from patients with breast cancer. (B) Correlation analysis in the cerebral metastasis tissues from patients with lung cancer. Colors indicate a positive (dark grey) or negative (light grey and white) correlation as follows: Very dark grey (ρ>0,8), mid-dark grey (0.8>ρ>0.5) and dark gray (0.5>ρ>0) colors indicate a positive correlation coefficient, and white (ρ<−0,8), mid-light grey (−0.8>ρ<−0,5) and light grey (−0.5>ρ<0) colors indicate a negative correlation coefficient. *P≤0.05 and **P≤0.01.


