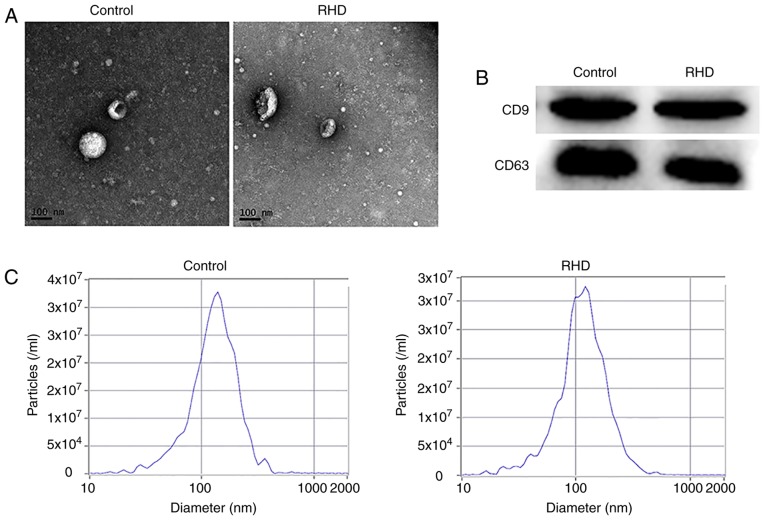
Figure 2.
Identification of serum exosomes. (A) Transmission electron micrograph of exosomes, their morphology was round vesicles with double membranes; scale bar: 100 nm. (B) Western blot analysis of CD9 and CD63; (C) The size and concentration of exosomes detected by the nanoparticle tracking analysis system, the peak diameters were 117.2 nm (RHD group) and 137.1 nm (control group), and the concentrations were 3.2×10⁷/ml (RHD group) and 3.3×10⁷/ml (control group). CD, cluster of differentiation; RHD, rheumatic heart disease.

