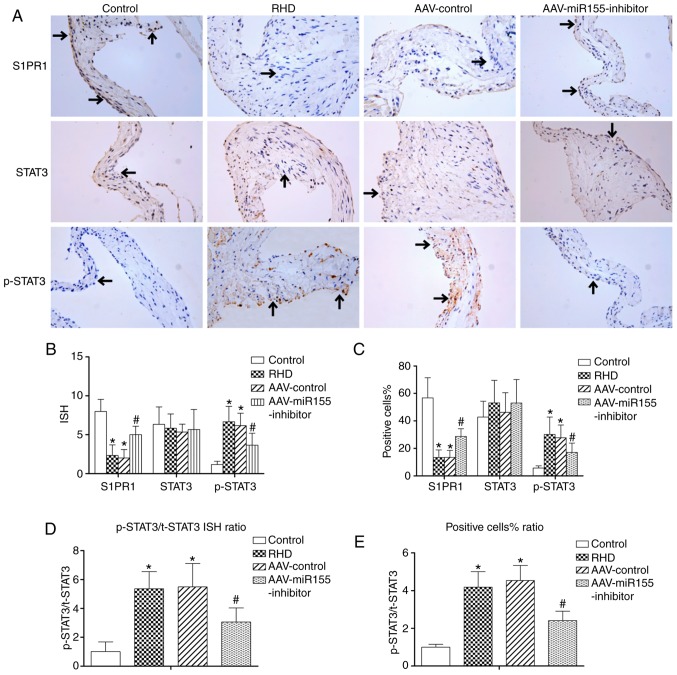
Figure 8.
Immunohistochemistry analysis of S1PR1, STAT3 and p-STAT3 in valve tissues. (A) Immunohistochemistry for S1PR1, STAT3 and p-STAT3 in valve tissues; magnification, ×400; the arrows represent positive cells. (B) The IHS. (C) The positive cells percentage. This figure shows that expression of S1PR1 was increased and expression of p-STAT3 was decreased after AAV-injection. (D) The ratio of phosphorylated vs. total protein for STAT3 (ISH score). (E) The ratio of phosphorylated vs. total protein for STAT3 (positive cells percentage). Data are shown as the mean ± standard deviation; *P<0.05 vs. the control group. #P<0.05 vs. the RHD group. S1PR1, sphingosine-1-phosphate receptor 1; t-STAT3, total-signal transducer and activator of transcription 3; p-STAT3, phosphorylated STAT3; IHS, immunohistochemical score; RHD, rheumatic heart disease.

