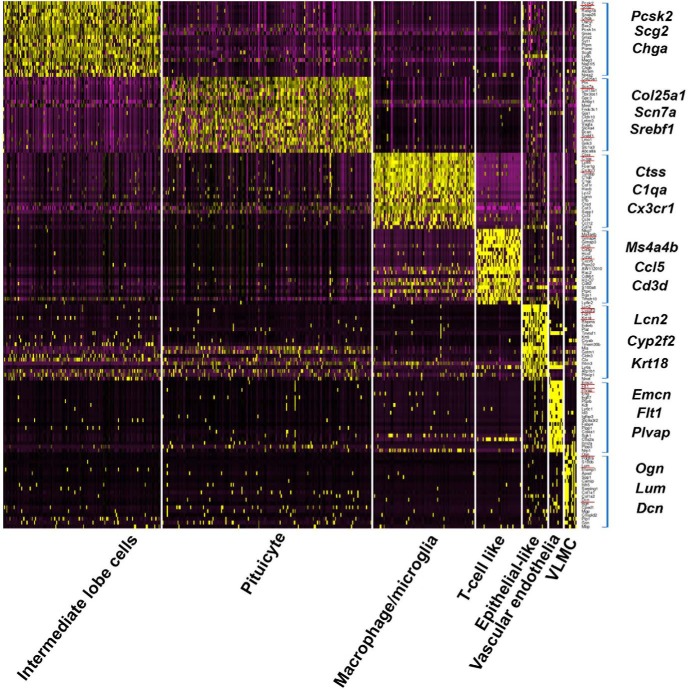
Figure 2.
Heatmap of differentially expressed genes in neurohypophyseal and IL cell clusters. Heatmap showing scaled gene expression of the top twenty genes (square brackets) representing each of the seven cell types found in the NH and IL. Each column display gene expression of an individual cell and genes are listed in the rows. Selected marker genes are underlined in red and enlarged on the side.

