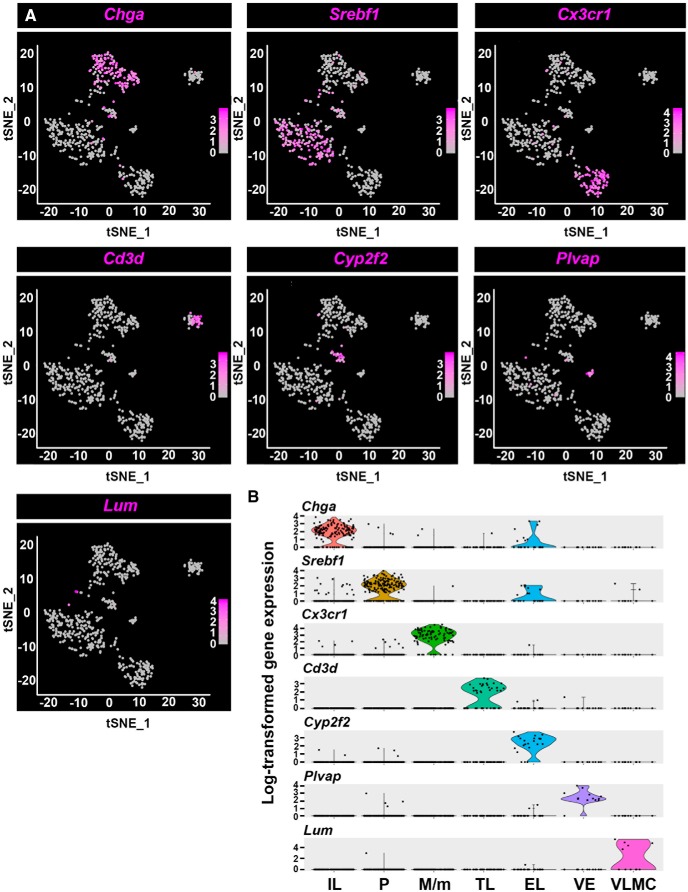
Figure 3.
Featured genes representing the landscape of the seven neurohypophyseal and IL cell types. A, Distribution of featured genes from each cell type embedded in tSNE plots. The gene expression scale was color-coded with high expression level in deep blue, low expression in gray. B, Violin plots displaying normalized log-transformed expressions of each featured gene distributed across all the seven clusters. EL, epithelial-like cells; M/m, macrophage/microglia; P, pituicyte; TL, T-cell like; VE, vascular endothelia.

