
Figure 3.
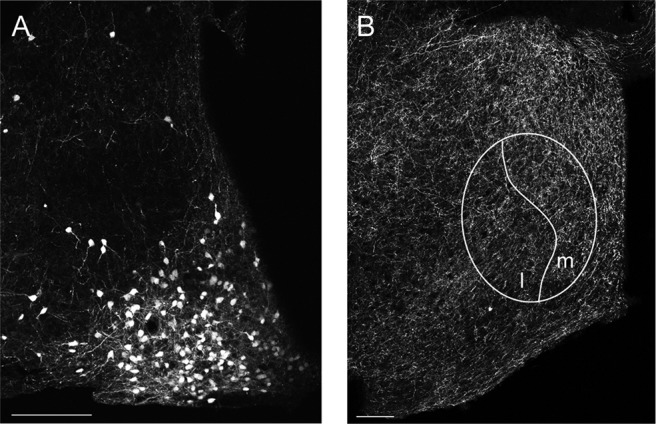
ChR2 expression in ARH and MPN. A representative image showing (A) soma and fiber expression of ChR2-tdTomato in the ARH, and (B) fiber expression in the MPN in the same animal. The MPN is shown at the level containing the medial (m) and lateral (l) subdivisions. 3V, 3rd ventricle. Scale bars = 100 µm.