
Figure 6.
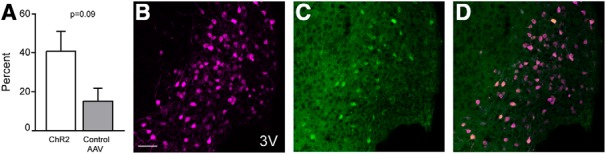
cFOS expression in the ARH is increased following photostimulation. IHC for cFOS was run to confirm activity in POMC neurons in the ARH. A, Following photostimulation, cFOS trended toward greater expression in neurons in mice with ChR2 than those that had the control virus (ChR2 mean, 41.3 ± 9.6%; control AAV mean, 15.7 ± 6.2%; p = 0.09), though this effect was not statistically significant, likely due to a lack of statistical power. tdTomato in magenta (B), cFOS in green (C), and merged image with both tdTomato and cFOS (D) in a representative mouse expressing ChR2 in the ARH. Double-labeled neurons appear yellow. Scale bar = 50 µm. 3V, 3rd ventricle. All values expressed as mean ± SEM.