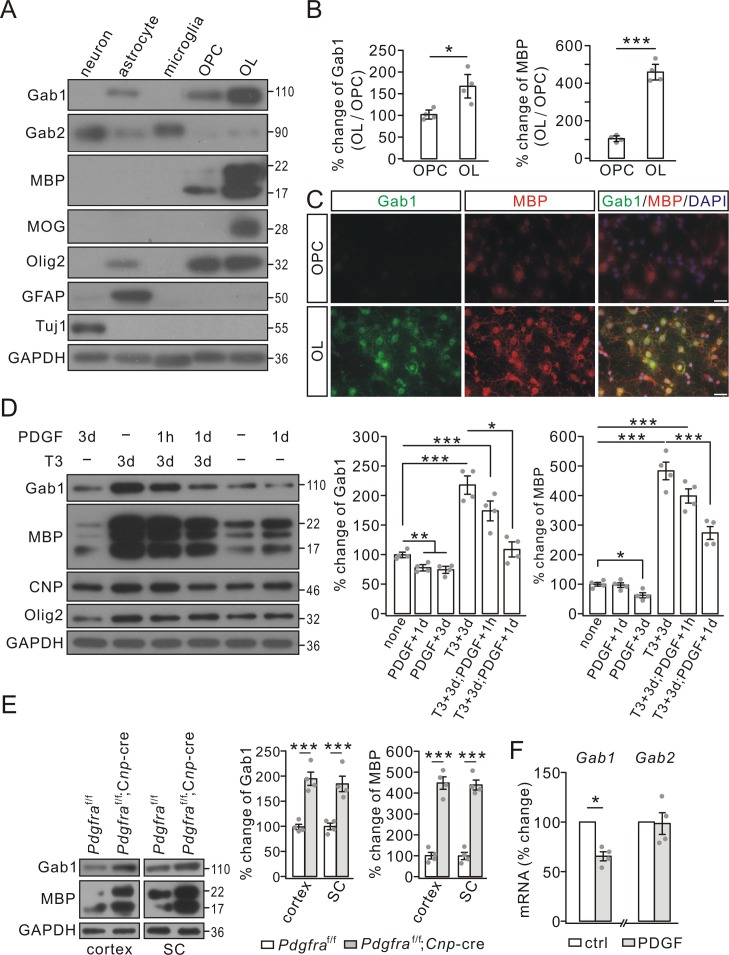
Figure 1. Gab1 expression increased during OPC differentiation but was reduced by PDGF in vitro.
(A) The expressions of Gab1, Gab2, myelin-related proteins, and cell-specific marker proteins in cultured neurons, astrocytes, microglia, OPCs, and OLs. (B) The blots of Gab1 and MBP were normalized to corresponding GAPDH and their ratios in OL vs. OPC (OL/OPC) were shown as the percentage changes of OPC group. Gab1: 100 ± 7% (OPC) and 169 ± 21% (OL), p=0.014. MBP: 100 ± 10% (OPC) and 459 ± 31% (OL), p=0.00002, n = 4/group, t-test, df = t(7). (C) The immunostaining of Gab1 and MBP in cultured OPCs and OLs. Scale bars: 20 μm. (D) PDGF and triiodothyronine (T3) were administered to OPC cultures as indicated. Gab1 and MBP were normalized to GAPDH and percentage changes are shown in bar graphs. Gab1: 100 ± 4% (none), 78 ± 4% (PDGF+1d), 74 ± 5% (PDGF+3d), 218 ± 15% (T3+3d), 174 ± 16% (T3+3d;PDGF+1 hr), and 108 ± 12% (T3+3d;PDGF+1d), p values: 0.0056 (none vs PDGF+1d), 0.0044 (none vs PDGF+3d), 0.00015 (none vs T3+3d), 0.0021 (none vs T3+3d;PDGF+1 hr), and 0.046 (T3+3d;PDGF+1 hr vs T3+3d;PDGF+1d). MBP: 100 ± 7% (none), 97 ± 9% (PDGF+1d), 63 ± 10% (PDGF+3d), 484 ± 34% (T3+3d), 399 ± 28% (T3+3d;PDGF+1 hr), and 274 ± 26% (T3+3d;PDGF+1d), p values: 0.012 (none vs PDGF+3d), 0.000015 (none vs T3+3d), 0.000019 (none vs T3+3d;PDGF+1 hr), and 0.0013 (T3+3d vs T3+3d;PDGF+1d). n = 4/group. ANOVA, df = F(4, 19). (E) The expressions of Gab1, MBP and GAPDH in the cerebral cortex and spinal cord (SC) from P21 Pdgfraf/f and Pdgfraf/f;Cnp-Cre mice. Gab1 and MBP were normalized to corresponding GAPDH and the percentage changes are shown. Gab1: 100 ± 6% (cortex; Pdgfraf/f) and 195 ± 15% (cortex; Pdgfraf/f;Cnp-Cre) (p=0.00053); 100 ± 8% (SC; Pdgfraf/f) and 185 ± 18% (SC; Pdgfraf/f;Cnp-Cre) (p=0.0023). MBP: 100 ± 22% (cortex; Pdgfraf/f) and 449 ± 34% (cortex; Pdgfraf/f;Cnp-Cre) (p=0.000049); 100 ± 20% (SC; Pdgfraf/f) and 439 ± 27% (SC; Pdgfraf/f;Cnp-Cre) (p=0.000024). n = 4/group. t-test, df = t(7). (F) The mRNA levels of Gab1 and Gab2 were quantified by comparative Ct method. The ratios of Gabs to Gapdh in control (ctrl) and PDGF (1d) groups were calculated and normalized to the control, and the percentage changes are shown in bar graphs. Gab1: 66 ± 5% (p=0.032 vs control), n = 4/group. Gab2: 99 ± 14% (p=0.75 vs control), n = 4/group, t-test, df = t(7). Gray dots indicate individual data points. *p<0.05. ***p<0.001.

