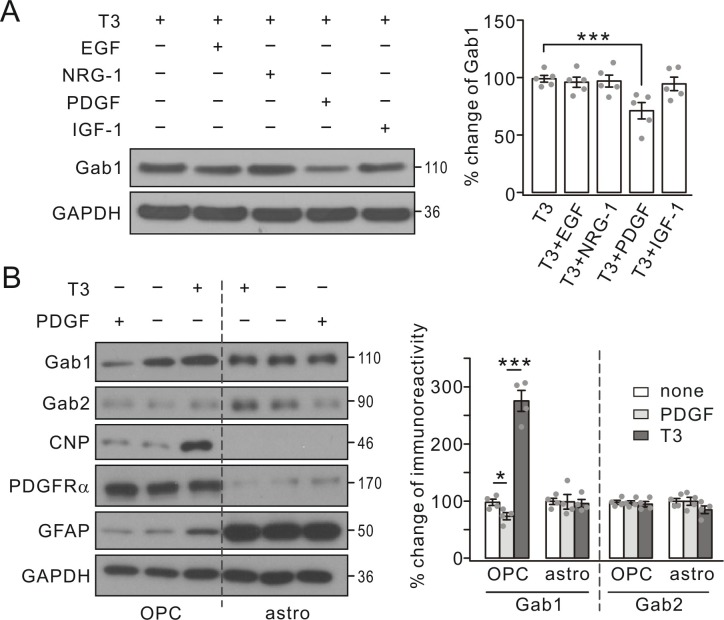
Figure 2. Gab1 expression was specifically suppressed by PDGF.
(A) Triiodothyronine (T3) was administered to OPC cultures along with EGF, NRG-1, PDGF or IGF-1, as indicated by ‘+’ and ‘-’. Gab1 expression was normalized to GAPDH and percentage changes are shown in bar graphs. T3: 100 ± 3%. T3+EGF: 97 ± 5%. T3+NRG-1: 98 ± 6%. T3+PDGF: 71 ± 8%. T3+IGF-1: 94 ± 7%. p values: 0.59 (T3 vs T3+EGF), 0.75 (T3 vs T3+NRG-1), 0.0072 (T3 vs T3+PDGF), and 0.52 (T3 vs T3+IGF-1). n = 5/group. ANOVA, df = F(4, 20). (B) T3 or PDGF was administered to OPC and astrocytic (astro) cultures, as indicated by ‘+’ and ‘-’. Lysates were probed with antibodies to proteins labeled in the left. The expression of Gab1 and Gab2 was normalized to corresponding GAPDH and the percentage changes are shown in bar graphs. Gab1-OPC: 100 ± 5% (none), 74 ± 7% (PDGF), 276 ± 21% (T3), and p values: 0.029 (none vs PDGF) and 0.000087 (none vs T3). Gab1-astro: 100 ± 6% (none), 100 ± 15% (PDGF), 96 ± 8% (T3), and p values: 0.96 (none vs PDGF) and 0.69 (none vs T3). Gab2-OPC: 100 ± 4% (none), 97 ± 4% (PDGF), 95 ± 5% (T3), and p values: 0.85 (none vs PDGF) and 0.61 (none vs T3). Gab2-astro: 100 ± 6% (none), 100 ± 8% (PDGF), 85 ± 8% (T3), and p values: 0.99 (none vs PDGF) and 0.13 (none vs T3). n = 4/group. ANOVA, df = F(2, 9). Gray dots indicate individual data points. ***p<0.001.

