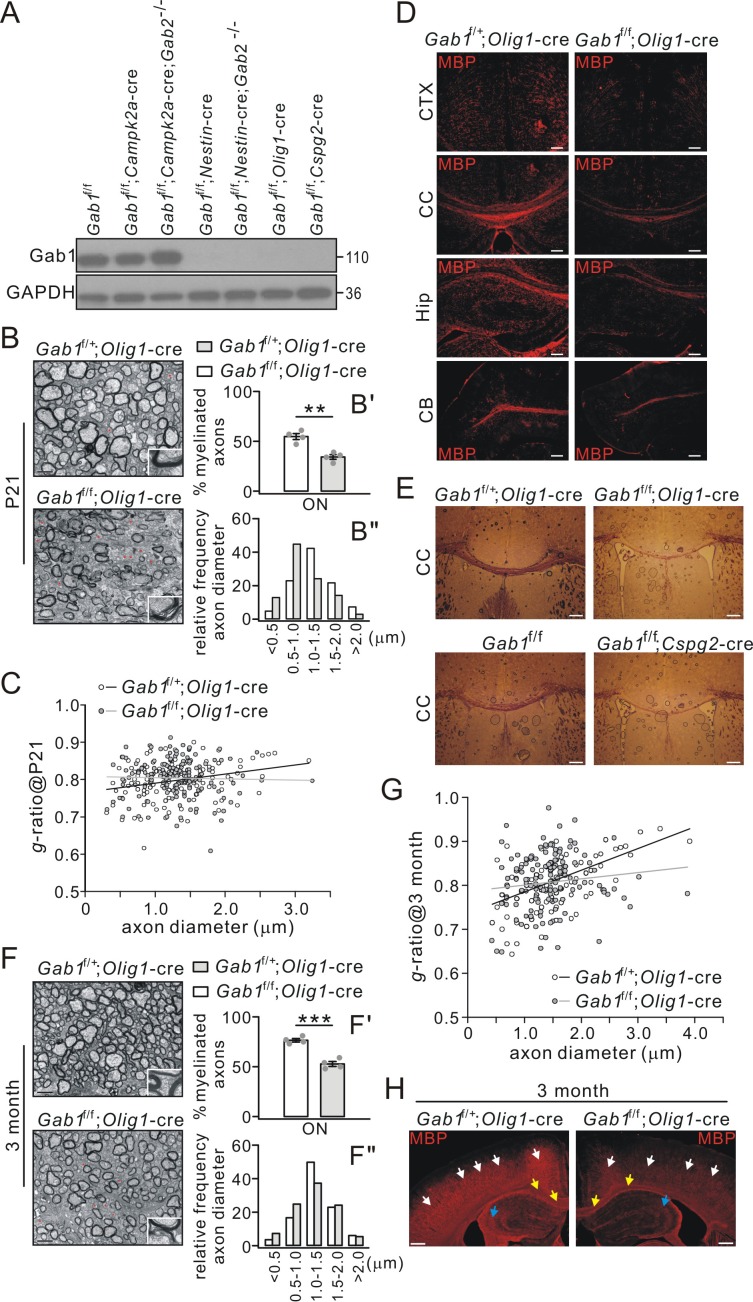
Figure 3. Impaired CNS myelination in conditional Gab1-knockout mice.
(A) Gab1 expression in Gab1f/f, Gab1 conditional knockout, and Gab1/Gab2 double mutant mice (P21). (B) TEM images of optic nerve (ON) from Gab1f/+;Olig1-cre and Gab1f/f;Olig1-cre mice (P21). Unmyelinated axons are indicated by red asterisks. Scale bars, 0.5 μm. The insets show typical axons from two groups. (B’) shows the percentages of myelinated axons: Gab1f/+;Olig1-cre: 55 ± 3% (4 animals); Gab1f/f;Olig1-cre: 34 ± 3% (4 animals), p=0.002, t-test, df = t(7). (B”) shows the distribution of axonal size in optic nerve (n = 160 axons in each group). (C) The relationship between diameters and g-ratios of axons from Gab1f/+;Olig1-cre and Gab1f/f;Olig1-cre mice (P21). Averaged g-ratios were 0.80 ± 0.04 (Gab1f/+;Olig1-cre, 154 axons from four animals) and 0.80 ± 0.05 (Gab1f/f;Olig1-cre, 148 axons from four animals), p=0.26, t-test, df = t(300). (D) MBP staining of cerebral cortex (CTX), corpus callosum (CC), hippocampus (Hip), and cerebellum (CB) from Gab1f/+;Olig1-cre and Gab1f/f;Olig1-cre mice (P21). Scale bars, 50 μm. (E) Black-gold staining of corpus callosum from Gab1f/+;Olig1-cre vs. Gab1f/f;Olig1-cre mice (P21) or from Gab1f/f vs. Gab1f/f;Cspg2-cre mice (P21). Scale bars, 200 μm. (F) TEM images of optic nerve (ON) from Gab1f/+;Olig1-cre and Gab1f/f;Olig1-cre mice at 3 month. Unmyelinated axons are indicated by red asterisks. Scale bars, 0.5 μm. The insets show typical axons from two groups. (F’) shows the percentages of myelinated axons: Gab1f/+;Olig1-cre: 77 ± 2% (4 animals); Gab1f/f;Olig1-cre: 53 ± 3% (4 animals), p=0.0002, t-test, df = t(7). (F”) shows the distribution of axonal size in optic nerve (n = 160 axons in each group). (G) The relationship between diameters and g-ratios of axons from mice at 3 months. Averaged g-ratios were 0.81 ± 0.06 (Gab1f/+;Olig1-cre, 141 axons from four animals) and 0.81 ± 0.06 (Gab1f/f;Olig1-cre, 141 axons from four animals), p=0.87, t-test, df = t(280). (H) MBP staining in the cerebral cortex (white arrows), the corpus callosum (yellow arrows) and the hippocampus (blue arrows) from Gab1f/+;Olig1-cre and Gab1f/f;Olig1-cre mice at 3 months. Note that MBP intensity was reduced in Gab1f/f;Olig1-cre compared to Gab1f/+;Olig1-cre mice. Scale bars, 200 μm. Gray dots indicate individual data points. **p<0.01. ***p<0.001.

