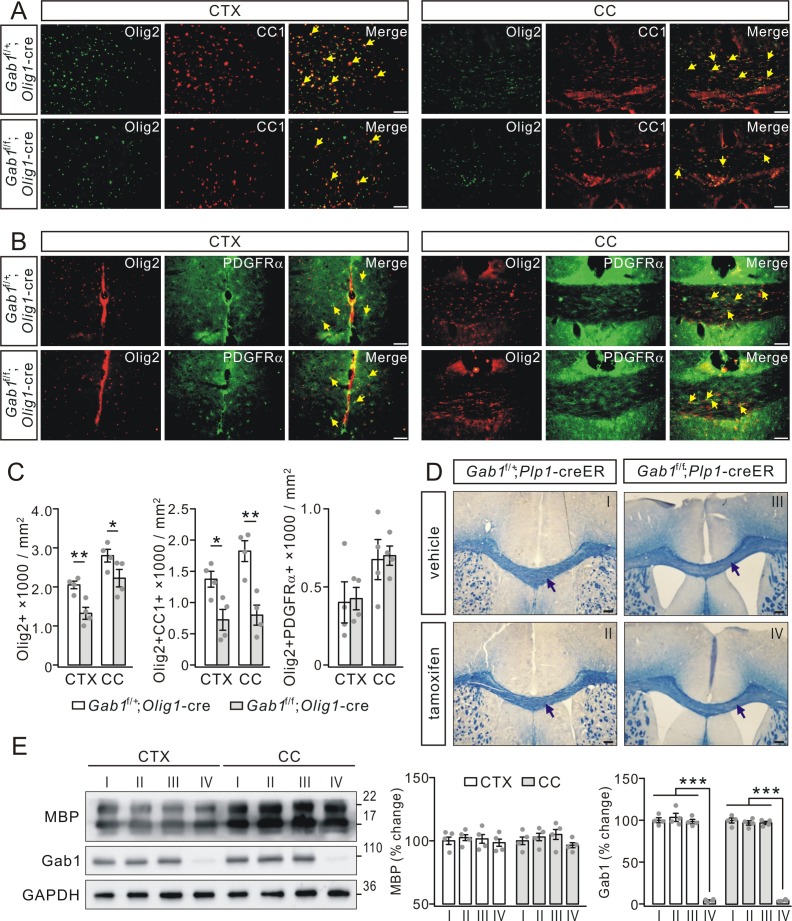
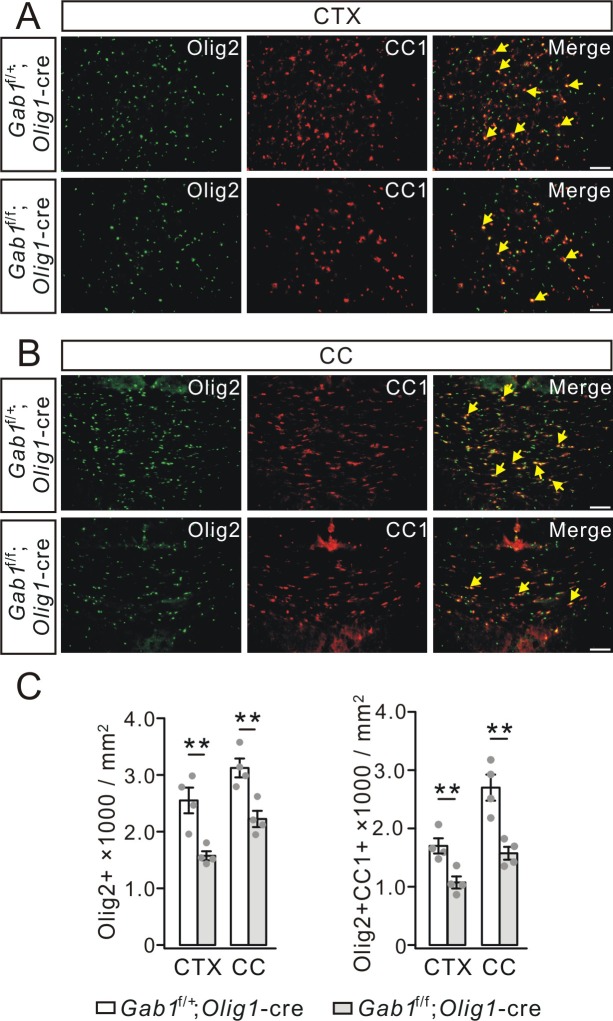
Figure 5. Gab1 deletion impairs OPCs differentiation.
(A) The double-immunostaining of Olig2 and CC1 in the cerebral cortex (CTX) and corpus callosum (CC) from Gab1f/+;Olig1-cre and Gab1f/f;Olig1-cre mice at P21. Cells positive to Olig2 and CC1 were recognized as myelinated OLs (yellow arrows). Scale bars, 50 μm. (B) The double-immunostaining of Olig2 and PDGFRα in the cerebral cortex and corpus callosum from Gab1f/+;Olig1-cre and Gab1f/f;Olig1-cre mice at P21. Cells positive to Olig2 and PDGFRα were recognized as OPCs (yellow arrows). Scale bars, 50 μm. (C) Bar graphs show the densities of Olig2+, Olig2+CC1+, and Olig2+PDGFRα+ cells in Gab1f/f;Olig1-cre and Gab1f/+;Olig1-cre mice at P21. The densities of Olig2+ cells were 2050 ± 111 (Gab1f/+;Olig1-cre) and 1325 ± 176 cells/mm2 (Gab1f/f;Olig1-cre) (CTX; p=0.007), and 2800 ± 188 (Gab1f/+;Olig1-cre) and 2225 ± 258 cells/mm2 (Gab1f/f;Olig1-cre) (CC; p=0.024). The densities of Olig2+CC1+ cells were 1375 ± 148 (Gab1f/+;Olig1-cre) and 724 ± 193 cells/mm2 (Gab1f/f;Olig1-cre) (CTX; p=0.02), and 1824 ± 193 (Gab1f/+;Olig1-cre) and 800 ± 186 cells/mm2 (Gab1f/f;Olig1-cre) (CC; p=0.005). The densities of Olig2+PDGFRα+ cells were 401 ± 152 (Gab1f/+;Olig1-cre) and 425 ± 83 cells/mm2 (Gab1f/f;Olig1-cre) (CTX; p=0.87), and 675 ± 148 (Gab1f/+;Olig1-cre) and 700 ± 71 cells/mm2 (Gab1f/f;Olig1-cre) (CC; p=0.87). n = 4/group, t-test, df = t(7). (D) Gab1f/+;Plp1-creER and Gab1f/f;Plp1-creER mice were (P180) treated with either vehicle or tamoxifen, and the corpus callosum of mice were collected at day 28 p.i. and stained with cyanine. No difference in the density of white matter tracts between vehicle and tamoxifen groups, as indicated by black arrows. Scale bars, 100 μm. (E) Western blots show that Gab1 was deleted in the cerebral cortex and the corpus callosum of Gab1f/f;Plp1-creER mice treated with tamoxifen. The Roman numbers I, II, III and IV that are also marked in (D) represent individual condition, Gab1f/+;Plp1-creER+vehicle, Gab1f/+;Plp1-creER+tamoxifen, Gab1f/f;Plp1-creER+vehicle, and Gab1f/f;Plp1-creER+tamoxifen, The percentage changes of MBP expression normalized to condition I were: cortex, 100 ± 4% (I), 102 ± 3%(II), 102 ± 5% (III), 99 ± 4% (IV); corpus callosum: 100 ± 4% (I), 103 ± 4%(II), 105 ± 6% (III), 97 ± 3% (IV). The percentage changes of Gab1 expression normalized to condition I were: cortex, 100 ± 3% (I), 103 ± 6% (II), 98 ± 3% (III), 4 ± 1% (IV); corpus callosum, 100 ± 4% (I), 97 ± 3% (II), 97 ± 2% (III), 4 ± 1% (IV). For all statistics, n = 4/group, t-test, df = t(7). Gray dots indicate individual data points. *p<0.05. **p<0.01. ***p<0.001.


