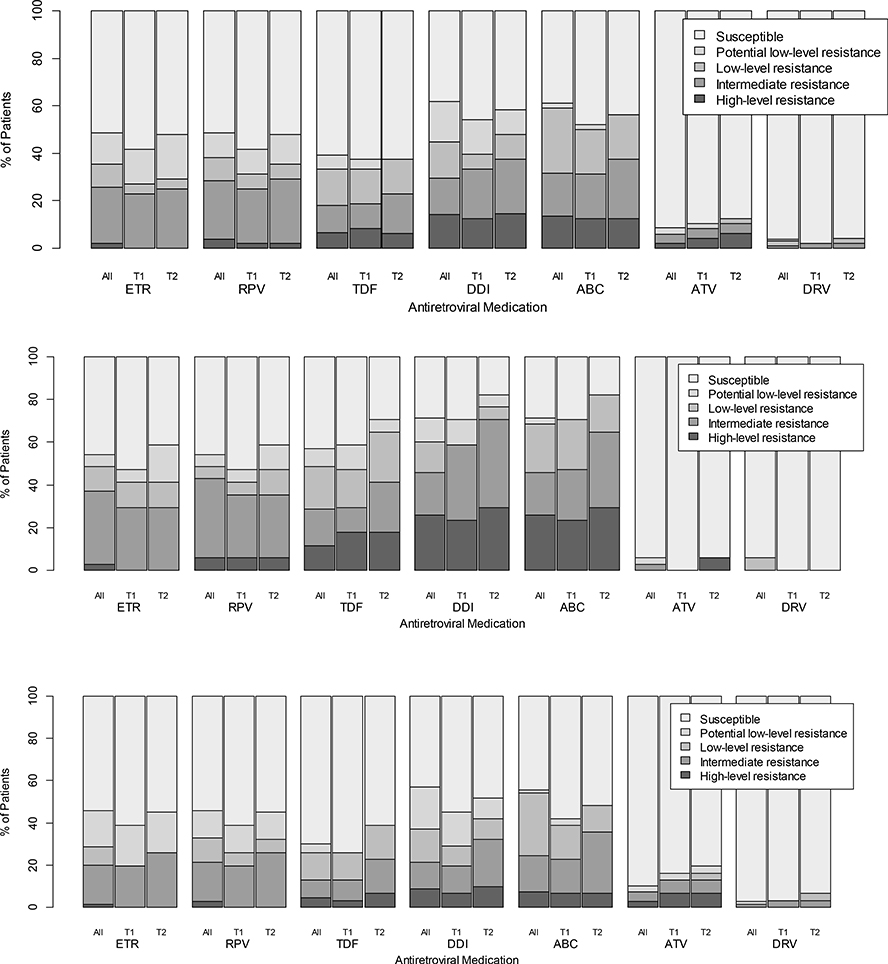
Figure 2: Predicted susceptibility to future drug options upon 2nd-line failure.
The figure demonstrates the proportion of patients (Y axis) that had one of five levels of predicted susceptibility (legend) to antiretroviral medications that might be considered for future treatment options (X axis). Results are provided for (i) 105 patients with genotypes at the first visit (All; left bars for each drug); (ii) Timepoint 1 (T1=first visit; center bars for each drug; for 48/105 participants with genotypes at both visits); and (iii) Timepoint 2 (T2=second visit; for 48/105 participants with genotypes at both visit right bars). Data are provided for all participants (top graph); those with low level viremia (middle graph); and those with viral load >1,000 copies/mL (lower graph).

