. 2020 Jan 8;9:e50843. doi: 10.7554/eLife.50843

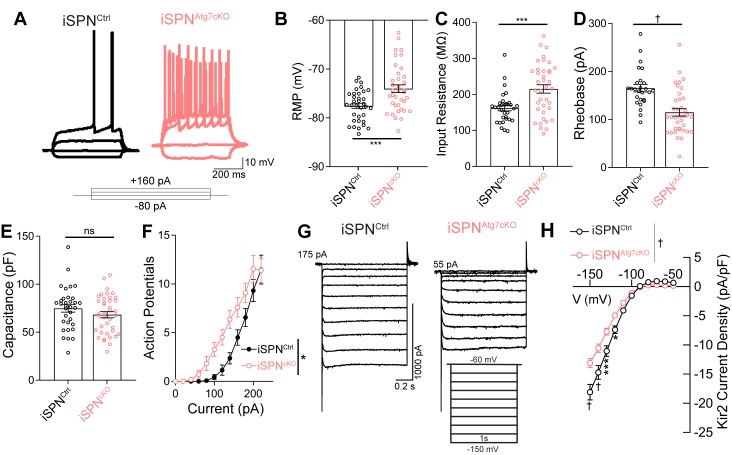
Figure 4. Loss of Atg7 leads to intrinsic hyperexcitability due to reduced Kir2 currents in iSPNs.

(A) Representative current clamp traces in iSPNs from control or iSPNAtg7cKO mice. (B-F) iSPNs lacking Atg7 display (B) depolarized resting membrane potential (t70=3.617, p = 0.0006; iSPNCtrl: n=34 (8), iSPNAtg7cKO: n=38 (9)), (C) elevated input resistance (t68=3.630, p = 0.0005; iSPNCtrl: n=32 (8), iSPNAtg7cKO: n=38 (9)), (D) decreased rheobase (t61=4.456, p<0.0001; iSPNCtrl: n=26 (7), iSPNAtg7cKO: n=37(9)), (E) no change in capacitance (t67 = 0.8096, p = 0.4210; iSPNCtrl: n=33 (8), iSPNAtg7cKO: n=39 (9)) and (F) a left-shifted current-response curve [APs/500 msec (Current x Genotype: F(13,772) = 1.538, p = 0.0983; Current F(13,772)=421.5, p<0.0001; Genotype: F(1,772) = 6.586, p = 0.0141); iSPNCtrl: n=25(7), iSPNAtg7cKO: n=36(8)]. Data in (B-F) analyzed with a two-tailed, unpaired t test. Data in (F) analyzed with two-way repeated measures ANOVA. (G) Representative voltage clamp recordings of Kir2 currents. (H) iSPNs have lower Kir2 current density in iSPNAtg7cKO mice compared to iSPNs in iSPNCtrl mice. iSPNCtrl: n = 17(5), iSPNAtg7cKO: n=25(6). Data analyzed with a two-way repeated measures ANOVA, followed by Bonferooni post-hoc test. Voltage x Genotype: F(10,400) = 13.39, p<0.0001. ns p>0.05, * p<0.05, *** p<0.001, † p<0.0001.

Figure 4.

Figure 4—figure supplement 1. Atg7 is required for maximal Kir2 current but does not affect Kir2 voltage dependence.

Figure 4—figure supplement 1.

(A–C) Representative traces of voltage clamp recordings of iSPNs in (A) ACSF, (B) ACSF + BaCl2, and (C) BaCl2-sensitive (Kir2) currents. (D-F) Reduction in Ba2+-sensitive current Kir2 current, but not the Ba2+-resistant leak current, in iSPNs lacking autophagy. iSPNCtrl: N = 19,5; iSPNAtg7cKO: N = 25,6. (D) Data analyzed with repeated measure two-way ANOVA. Voltage x Genotype: F(10,400) = 13.31, p<0.0001. (E) Data analyzed with repeated measure two-way ANOVA. Voltage x Genotype: F(10,400) = 1.852, p = 0.0503; Voltage: F(10, 400)=250.1, p<0.0001; Genotype: F(1,40)=2.942, p = 0.0941. (F) Data analyzed with repeated measure two-way ANOVA. Voltage x Genotype: F(10,400) = 17.33, p<0.0001. (G) No difference in the voltage dependence or (H) voltage at half-maximal activation for Kir2 currents between genotypes. (G) Data analyzed with repeated measure, two-way ANOVA. Voltage x Genotype: F(10,400) = 0.8522, p = 0.5785; Voltage: F(10,400)=2599, p<0.0001; Genotype: F(1,40) = 0.01361, p = 0.9077. (I) Slope of Kir2 current is greater in iSPNControl than iSPNAtg7cKO cells. Data in (H-I) analyzed with a two-tailed, unpaired t test. Data in D-G were analyzed with a repeated measures two-way ANOVA followed by Bonferroni post-hoc tests. Data in H and I were analyzed with a two-tailed unpaired t test. ns p>0.05, *p<0.05, **p<0.01, ***p<0.001, † p<0.0001.