. 2020 Jan 8;9:e50843. doi: 10.7554/eLife.50843

Figure 5. Autophagy is required for Kir2 degradation.

(A–C) There was no difference in Kir2.1 or Kir2.3 mRNA expression in SPNs of iSPNAtg7cKO mice in an RNAscope assay (N = 77–173 cells from three mice per group). Inset shows just RNAscope and DAPI. Scale bar 30 µm. Data analyzed by the Kolmogorov-Smirnov test, Genotype effect: p>0.05 for Kir2.1 and Kir2.3. (D) Representative western blots of specified proteins from total striatal lysates from iSPNCtrl or iSPNAtg7cKO mice. Quantifications of (E) p62 (t20 = 3.551, p = 0.0020), (F) DARPP32 (t23 = 1.984, p = 0.0593), (G) Kir2.1 (t14 = 3.435, p = 0.0040), and (H) Kir2.3 (t14 = 4.492, p = 0.0005) relative to actin. p62: iSPNctrl: n = 11, iSPNAtg7cKO: n = 11. DARPP32: iSPNctrl: n = 14, iSPNAtg7cKO: n = 11. Kir2.1: iSPNctrl: n = 7, iSPNAtg7cKO: n = 9. Kir2.3: iSPNctrl: n = 7, iSPNAtg7cKO: n = 9. Data analyzed by two-tailed, unpaired t test. (I-J) Kir2.1 is localized in LC3-GFP+ puncta in Atg5WT but not Atg5KO MEFs. BafilomycinA1 (BafA1; 100 nM 2 hr) treatment increases the number of LC3/Kir2.1-double labeled puncta in Atg5WT MEFs. Scale bar 20 µm. Inset scale bar 1 µm. Analyzed by one-way ANOVA followed by Bonferroni post-hoc test. F(2,26)=25.64, p<0.0001. (K-L) A reduction of Lamp1+Kir2.1+ puncta in Atg5KO MEFs. Scale bar 20 µm, inset scale bar 1 µm. Data analyzed by two-tailed, unpaired t test. t23 = 3.083, p = 0.0053. (M) Reduced degradation of SNAP-tag labeled Kir2.1 in Atg5KO MEFs. N: (WT,KO): T = 0 min (35,30), T = 30 min (30,27), T = 60 min (25,38), T = 180 min (33,67), T = 360 min (40,20). Data analyzed by two-way ANOVA. Genotype x time: F4,335 = 7.880, p<0.0001. (N) No significant difference in the internalization of antibody-labeled surface Kir2.1 channels in Atg5KO MEFs. N: (WT,KO): T = 0 min (76,56), T = 30 min (52,37), T = 60 min (41,42), T = 120 min (28,38). Data analyzed by two-way ANOVA. Genotype x time: F3,362 = 0.8038, ns; Time: F(3,362) = 25.88, p = 0.0001; Genotype: F(1,362) = 1.877, ns. ns p>0.05, *p<0.05, **p<0.01, ***p<0.001, † p<0.0001.

Figure 5—source data 1. Source data for Figure 5.

Figure 5.

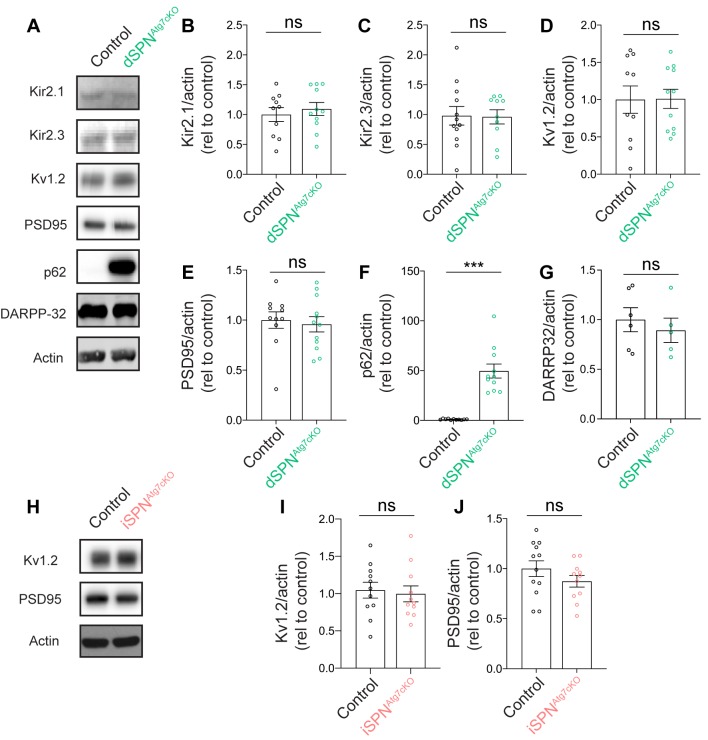
Figure 5—figure supplement 1. Loss of autophagy does not affect Kir2.1 expression in dSPNAtg7cKO mice.

Figure 5—figure supplement 1.

(A) Representative western blots from control or dSPNAtg7cKO mice. (B-G) Quantification of relative protein levels in control and dSPNAtg7cKO mice shows no significant difference between (B) Kir2.1 [dSPNCtrl: n = 10, dSPNAtg7cKO: n = 11; t19 = 0.5816, p = 0.5677], (C) Kir2.3 [dSPNCtrl: n = 12, dSPNAtg7cKO: n = 10; t20 = 0.08775, p = 0.9309], (D) Kv1.2 [dSPNCtrl: n = 10, dSPNAtg7cKO: n = 11; t19 = 0.04627, p = 0.9636], (E) PSD95 [dSPNCtrl: n = 11, dSPNAtg7cKO: n = 12; t21 = 0.3730, p = 0.7129], or (G) DARPP32 [dSPNCtrl: n = 6, dSPNAtg7cKO: n=5; t= 0.6178, p = 0.5520], but a significant increase in (F) p62 [dSPNCtrl: n = 11, dSPNAtg7cKO: n = 11; t20=6.936, p<0.0001]. (H) Representative western blots for Kv1.2 and PSD95 in control or iSPNAtg7cKO mice. (I-J) Quantification of Kv1.2 [iSPNCtrl: n = 11, iSPNAtg7cKO: n = 11; t20 = 0.3213, p = 0.7513] and PSD95 [iSPNCtrl: n = 12, iSPNAtg7cKO: n = 11; t21 = 1.264, p = 0.2202] shows no difference between control and iSPNAtg7cKO mice. Data analyzed by two-tailed unpaired t test. ns p>0.05, *** p<0.0001.
Figure 5—figure supplement 1—source data 1. Source data for Figure 5—figure supplement 1.
Figure 5—figure supplement 1—source data 2. Source Data for Figure 5—figure supplement 1 continued.
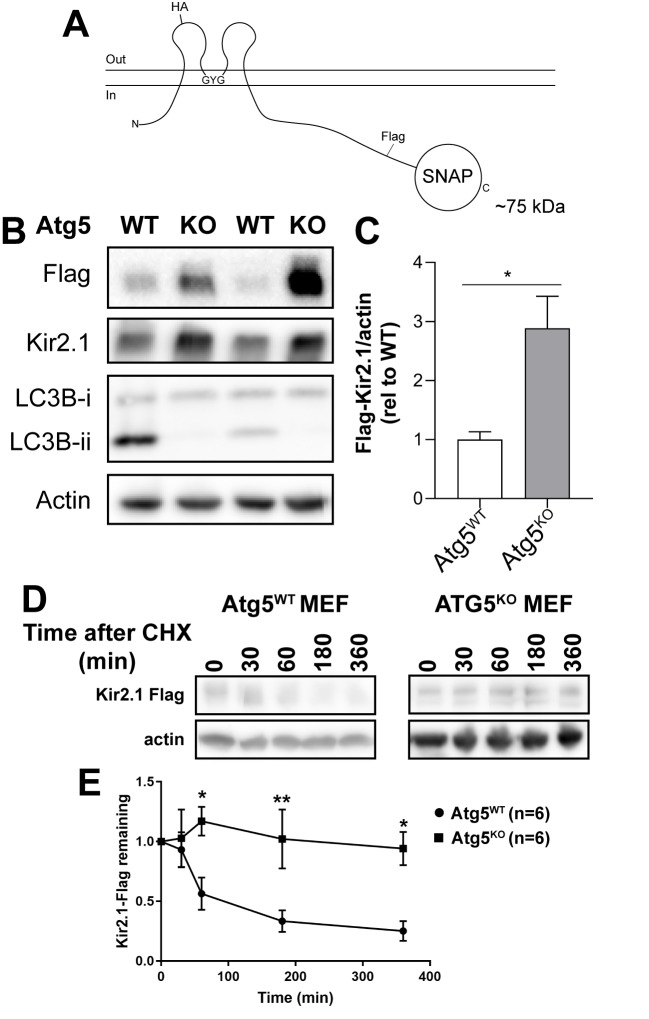
Figure 5—figure supplement 2. Higher steady-state levels of Kir2.1 and reduced degradation of Kir2.1 in Atg5KO MEFs.

Figure 5—figure supplement 2.

(A) Schematic of Kir2.1-externalHA-Flag-SNAP (abb. Kir2.1 below) construct. (B) Representative western blots and (C) quantification for Flag, Kir2.1, LC3B and actin show elevated steady state levels of Kir2.1 in transiently transfected in Atg5KO MEFs compared to Atg5WT MEFs. N = 3 per genotype. Data analyzed with two-tailed unpaired t test, t4 = 3.390, p = 0.0275. (D and E) Representative blots and aggregate data from six independent replicates per timepoint treated with cycloheximide at t = 0 min. Data were analyzed with a two-way ANOVA followed by Bonferroni post-hoc test. Time x genotype: F(4,44)=2.764, p = 0.0391. ns p>0.05, *p<0.05, **p<0.01, ***p<0.001, † p<0.0001.
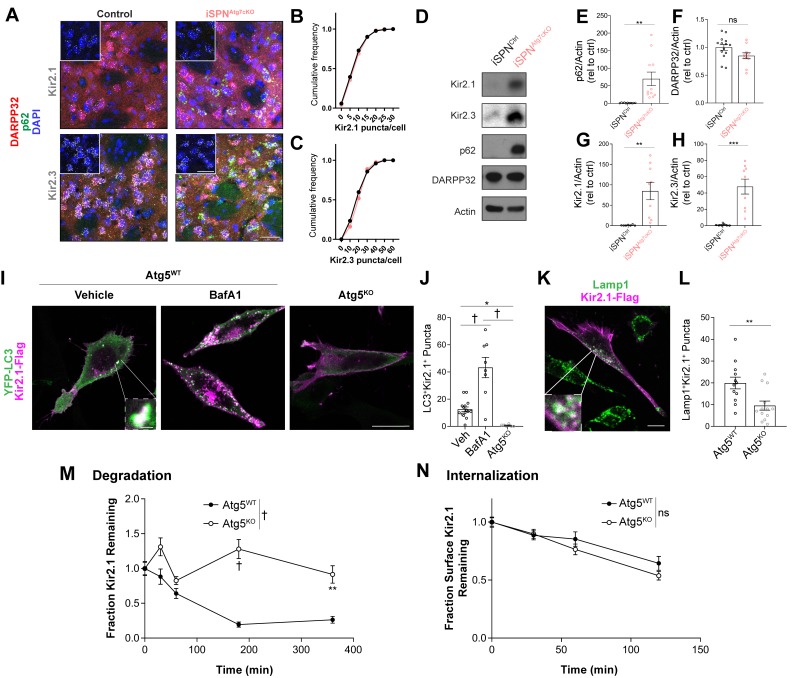
Figure 5—figure supplement 2—source data 1. Source Data for Figure 5—figure supplement 2B.
Figure 5—figure supplement 2—source data 2. Source Data for Figure 5—figure supplement 2D.
Figure 5—figure supplement 3. Kir2.1 degradation is disrupted in Atg7KO MEFs.

Figure 5—figure supplement 3.

(A) Representative western blot showing the absence of Atg7 in Atg7KO primary MEFs. (B) Representative images of primary MEFs transfected with Kir2.1-Flag-SNAP and labeled with SNAPcell ligand. (C) Snap-labeled Kir2.1 is significantly reduced in Atg7WT cells but not Atg7KO cells. N: (0,120 min) WT: (7,6), KO: (7,6). Data analyzed by two-way ANOVA. Genotype x time: F(1,22)=2.323, p = 0.1417; Genotype: F(1,22)=2.323, p = 0.1417. Time: F(1,22)=7.675, p = 0.0112. (D) The distribution of Kir2.1 is not different between Atg7WT and Atg7KO cells. Data are combined from two independent replicates. *p<0.05.
Figure 5—figure supplement 3—source data 1. Source Data for Figure 5—figure supplement 3A.