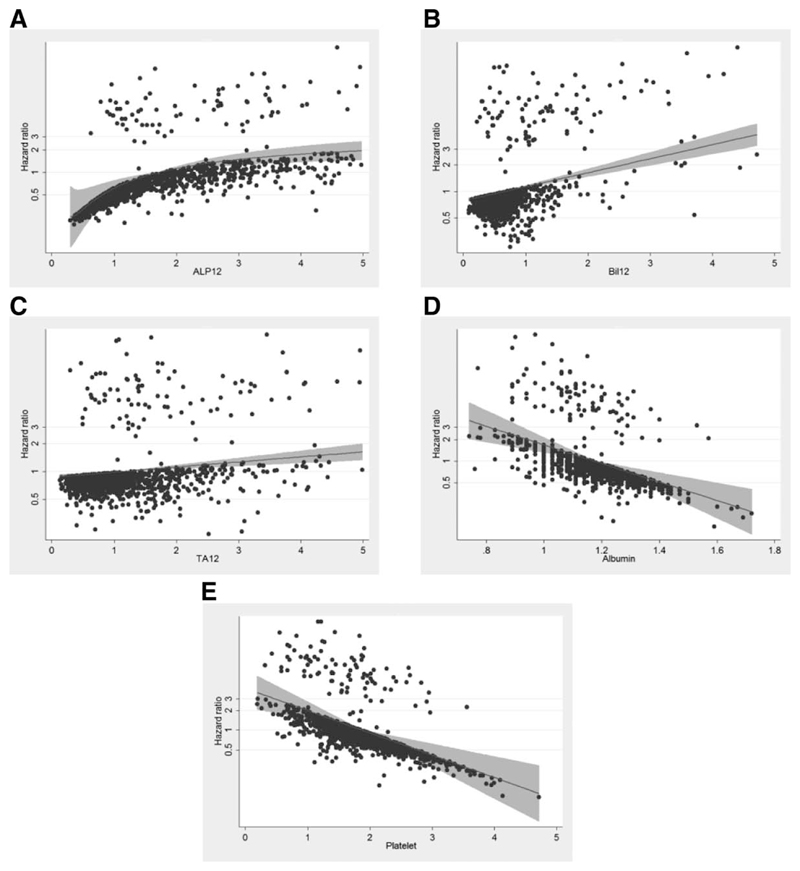
Fig. 1.
Relationship between the hazard ratio for a liver event (liver death or liver transplantation) and each variable within the final model together with the best-fitting polynomial line in the UK-PBC Research Cohort (A. ALP12; B. BIL12; C. TAl2; D. Albumin; E. Platelets). To allow for inter-operator variability, BIL12, TAl2 and ALP12 were analysed as multiples of their upper reference levels whereas Albumin and Platelets were analysed as multiples of their lower reference levels. The best-fitting polynomial line to describe the relationship between risk and each variable is shown. Note in particular that for each variable, risk increases or decreases as a continuum and there are no points at which the trajectory of risk suddenly changes, which suggests they are best modelled as continuous variables. Note also that some variables do not have a linear relationship with risk and for this reason, they were transformed using multivariable fractional polynomials (see text). Abbreviations: ALP12, alkaline phosphatase after 12 months of UDCA; BIL12, bilirubin after 12 months of UDCA; LLN, lower limit of normal; ULN, upper limit of normal; TA12, transaminases after 12 months of UDCA; UDCA, ursodeoxycholic acid.

