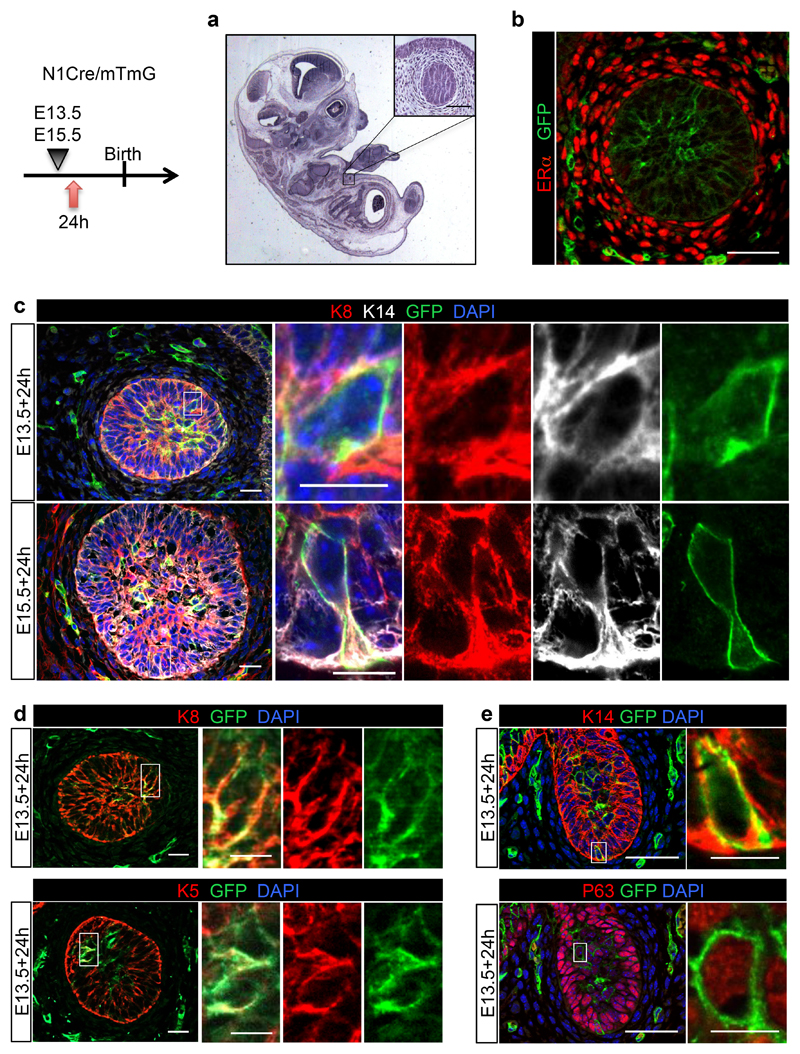
Figure 1. Embryonic mammary buds co-express luminal and basal markers.
Representative sections of mammary embryonic buds of N1Cre/mTmG embryos induced with tamoxifen at E13.5 (a, b, c, upper panel, d, e), or at E15.5 (c lower panel) and analysed 24h later by: hematoxylin coloration (a); immunostaining using an anti-ERα antibody (in red in b); immunofluorescence for the luminal marker K8 (in red, in c and d, upper panel) and the basal markers K14 (in white in c and in red in e, upper panel); K5 (in red, bottom panel in d); and p63 (in red, lower panel in e). GFPpos cells in green represent N1Cre-labelled embryonic cells in b-e. DAPI stains the nuclei in blue in c, e. Split channels for each colour are shown in the inset magnifications in c-d. 3 individual embryos for induction at E13.5 and 3 individual embryos for induction at E15.5. Scale bars correspond to 20 μm in b-e, and 10 μm in the magnifications in c-e.

