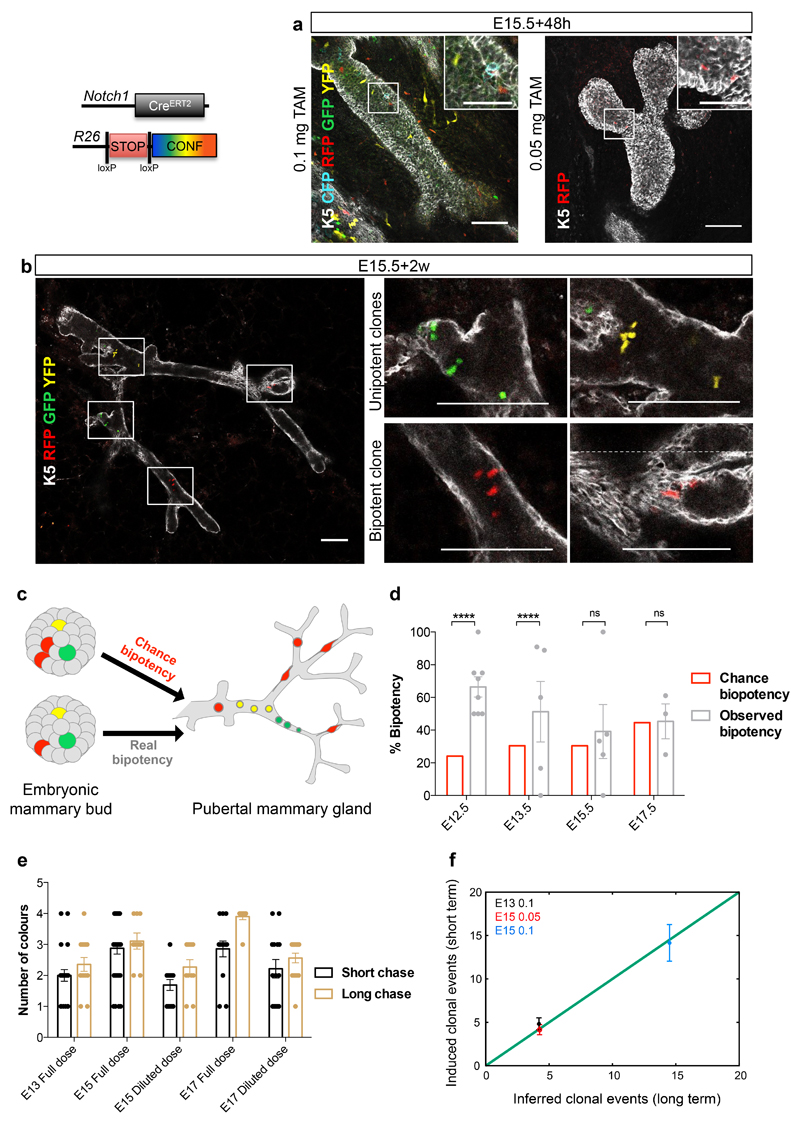
Figure 3. Notch1pos embryonic mammary cells show unipotent cell fate potential.
a-b. Single Z-stacks of wholemount immunostaining of mammary trees from N1Cre/Confetti mice, induced with 0.05mg or 0.1mg of tamoxifen at E15.5, analysed 48h (a) and 2 weeks later (b). Immunostaining for K5 (white) marks basal cells. GFP (green), Cyan (blue), YFP (yellow), RFP (red) mark Notch1-derived lineages considered as unique clones derived from one ESC; 98 glands in 30 embryos and 139 clones from 65 glands in 21 mice. Images were acquired as different tiles without overlap and stitched juxtaposed. Dotted line in (b) demarcates the stitching. c. Schematic diagram illustrating how 2 independent labelling events of unipotent cells (red cells, “chance bipotency”) can be confused with the unique labelling of a multipotent stem cell (red cell, “real bipotency”). d. Percentage of theoretical chance bipotency (red) compared to experimentally scored bipotency (grey) in 1-2 week-old N1Cre/Confetti mice induced with tamoxifen at indicated embryonic stages. n= 8, 5, 5, 3 independent animals induced at E12.5, E13.5, E15.5, E17.5. p values = P<0.0001, P<0.0001, P=0.5 and P=0.43. Tamoxifen dose was adjusted at each time point to reach comparable recombination efficiency, indicated by the average number of floxed colours/gland (see Methods). e. Average number of colours/gland from mice induced at indicated time points, with indicated doses, analysed after 48h (short chase, in black) or at P7 (long chase, in brown). Recombination efficiency (short chase) reflects the number of colours found at P7 (long chase) at each tamoxifen dose (differences not significant). n=22, 32, 13, 14, 14 independent mammary glands for short times, and n=14, 9, 11, 10, 16 for long chase. f. Number of induced clonal events scored after a short chase vs number of inferred clonal events estimated from a long chase. n=12, 9, 8 biologically independent animals induced at E13.5 full dose (black dots), E15.5 diluted dose (red dots) and E15.5 full dose (blue dots). Two-tailed binomial test was applied to assess statistical differences between groups. Graphs show mean ± SEM. Source data in Supplementary Table 1. Scale bars are 100 μm or 50 μm in the magnifications in (a), 100 μm in (b).

