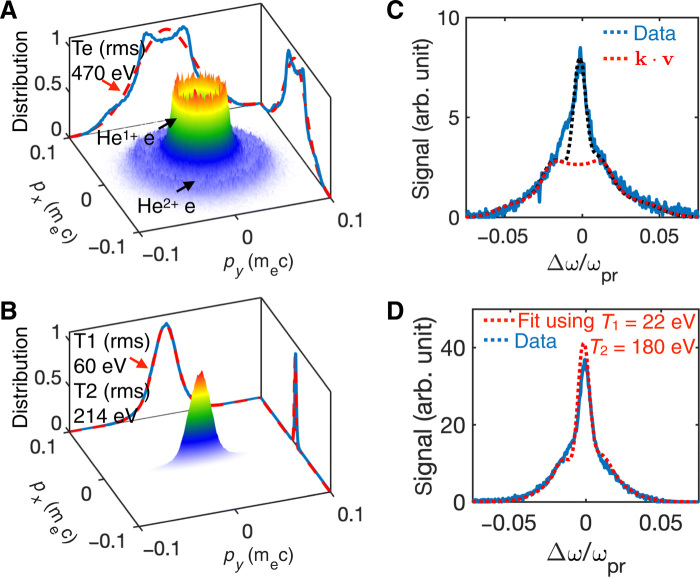
Fig. 1. Initial EVD of OFI helium plasma.
EVDs (A) for CP and (B) for LP laser pulse from 3D OSIRIS simulations. The solid blue lines in (A) and (B) show the projected distributions. In the CP case (A), the projected distribution deviates significantly from a Maxwellian distribution having the same root-mean-sqaure (rms) temperature of 470 eV, as shown by the red dashed line. In the LP case (B), the projected distribution can be well approximated by a two-temperature (1D Maxwellian) distribution with and = 214 eV. The blue lines in (C) and (D) show the measured TS spectrum for CP (C) and LP (D) for an initially fairly low plasma density of 6.6 × 1017 cm−3. The red dashed lines in (C) and (D) are fits to the measured spectrum (see the main text).

