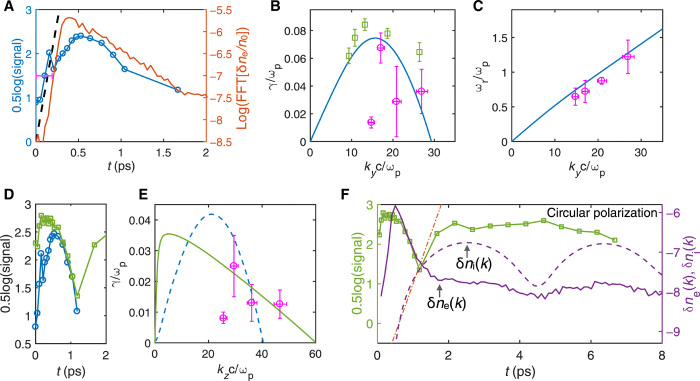
Fig. 4. Streaming, filamentation, and Weibel instabilities induced by circular polarization.
(A) The blue circles show the measured magnitude of the electron feature as a function of time (derived from Fig. 3B) for a plasma density of 6 × 1018 cm−3. The red line shows temporal evolution of the density fluctuation magnitude (instability wave amplitude) for the same probed value of k obtained from a 2D PIC simulation. The black dashed line shows the exponential growth of a linear wave from kinetic theory. The horizontal error bars mark the uncertainty in determining the t0 when ionization is completed. The vertical error bars represent the ±2σ confidence level. (B) Measured (magenta circles), predicted (blue line), and simulated (green squares) growth rates of the instability. (C) Measured (magenta circles) and predicted (blue line) frequencies of the streaming instability for the same range of densities as in (B). (D) Measured magnitude of the zero-frequency feature (green) and the electron feature (blue) within the first 2 ps. (E) The measured (circles) and calculated (green line) initial growth rates of the filamentation instability. The horizontal error bars show the uncertainty of density measurement, and the vertical error bars represent the ±σ confidence interval of the deduced growth rate. The blue dashed line shows the growth rate of the zero-frequency mode of the streaming instability. (F) Measured magnitude of the zero-frequency feature as a function of time (green squares, derived from Fig. 3B). The solid (dashed) purple line shows the evolution of the amplitude of the electron (ion) density fluctuation at the same k that is being probed in the experiment. The red dotted-dashed line shows the maximum growth rate of the Weibel instability calculated using the simulated EVD at t = 1 ps.

