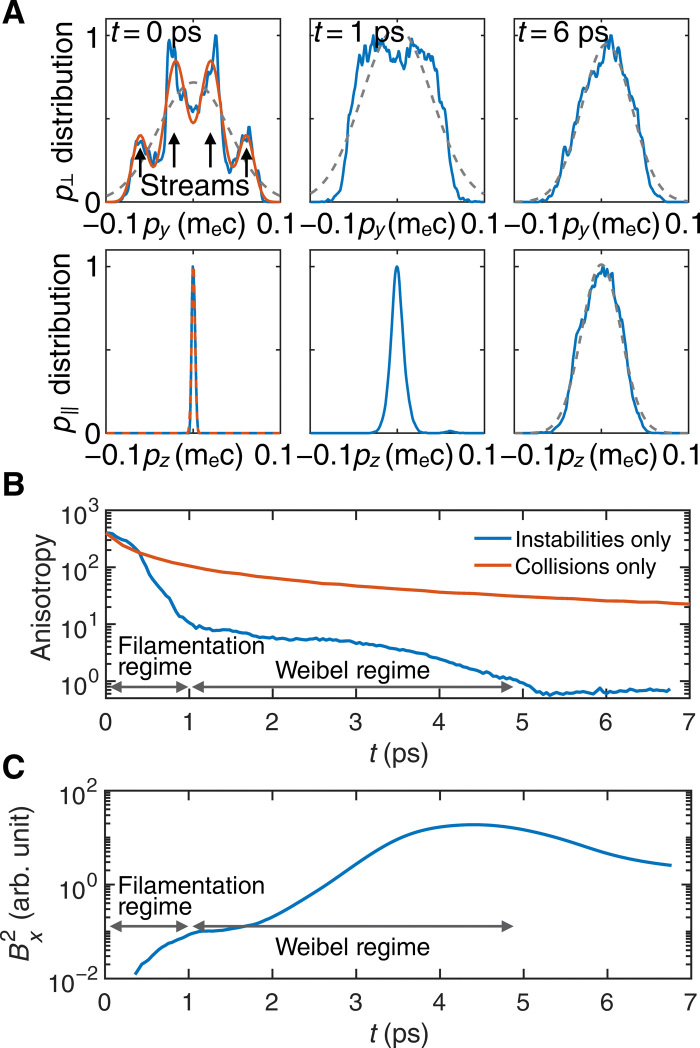
Fig. 5. Evolution of the temperature anisotropy of the OFI plasma.
The upper (lower) row in (A) shows the py (pz) distribution function of electrons at t = 0, 1, and 6 ps. The dashed gray line is a Gaussian fit to the distribution. The initial distribution can be approximated by four drifting Maxwellian beams in the transverse plane as indicated by the red line and the arrows. The red dashed line is a Gaussian fit to the pz distribution. (B) The blue line shows the anisotropy from the same simulation as in (A), which does not include collisions. The red line shows the simulation of anisotropy evolution of a preionized plasma with only Coulomb collisions included. (C) The average magnetic field energy as a function of time shows two distinct growth phases corresponding to filamentation and Weibel regimes, respectively.

