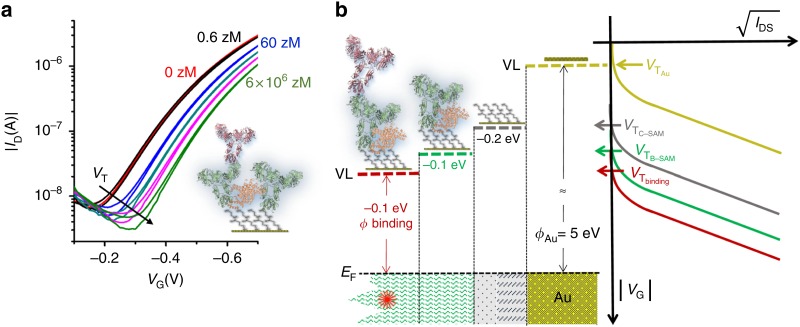
FIG. 7.
SiMoT sensing measurements. (a) Transfer curves with varied IgG concentrations of 6 zeptoMolar (zM, black curve), zM (blue curve), zM (dark curve), zM (magenta curve), and zM (light green curve) in PBS standard solutions. (b) Negative shifts in the work function with corresponding threshold voltage shifts at each functionalization step. EF is the gate electrochemical potential and VL is the vacuum level. Reproduced with permission from Macchia et al., Nat. Commun. 9, 3223 (2018). Copyright 2018, Author(s), licensed under Attribution 4.0 International (CC BY 4.0).

