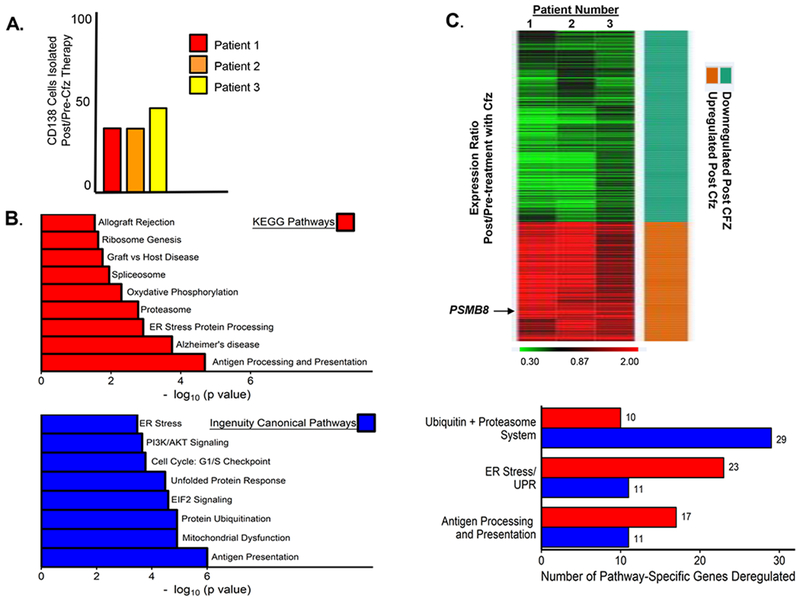
Figure 2.
Effect of in vivo carfilzomib therapy on gene expression in patient BMPCs. A. Proportion of live CD138+ cells recovered as a function of total bone marrow nucleated cells prior to and after in vivo carfilzomib therapy. Shown is the relative percent of live PCs recovered from the BM biopsies of three individual patients. Cell viability was determined using the trypan blue exclusion assay. Live PCs and the total number of nucleated BMMF cells isolated from individual patient BM biopsy were determined prior to and after in vivo carfilzomib therapy. Shown is the ratio of live CD138+PCs recovered from each patient post/pre-carfilzomib treatment. B. Unsupervised and supervised pathway analyses were performed to compare the genes differentially expressed in CD138+ PCs isolated from patients pre- and post in vivo carfilzomib therapy. KEGG and Ingenuity canonical pathway analyses were performed to identify the most significantly deregulated genes and pathways between BMPCs isolated pre- and post-carfilzomib therapy. Shown are the number of genes determined by either KEGG or Ingenuity canonical pathway analyses to be significantly deregulated in patient BMPCs following in vivo carfilzomib therapy. KEGG analysis generated an in-depth understanding of the differentially-expressed genes at the metabolic and functional levels, gene ontology functional annotation and KEGG pathway enrichment analysis were performed using DAVID (Database for Annotation, Visualization and Integration Discovery) http://david.abcc.ncifcrf.gov/. Canonical pathway analysis was performed using the Ingenuity Pathway Analysis tool (IPA, Ingenuity® Systems, www.ingenuity.com) employed using the DEGs. A p-value cutoff of 0.05 was considered statistically significant (Fisher’s exact test). C. Heat map depicting the genes down- or upregulated in each of the three HLA-sensitized patients following in vivo carfilzomib therapy. BMPCs were isolated from patients prior to and after in vivo carfilzomib therapy and then analyzed by RNA-seq. The heat map indicates genes that demonstrated a fold change ([Post]/[Pre]) greater than 1.5 in all three patients. Green indicates genes down regulated and red indicates those upregulated. A p-value cutoff of 0.05 was considered statistically significant (Fisher’s exact test).

