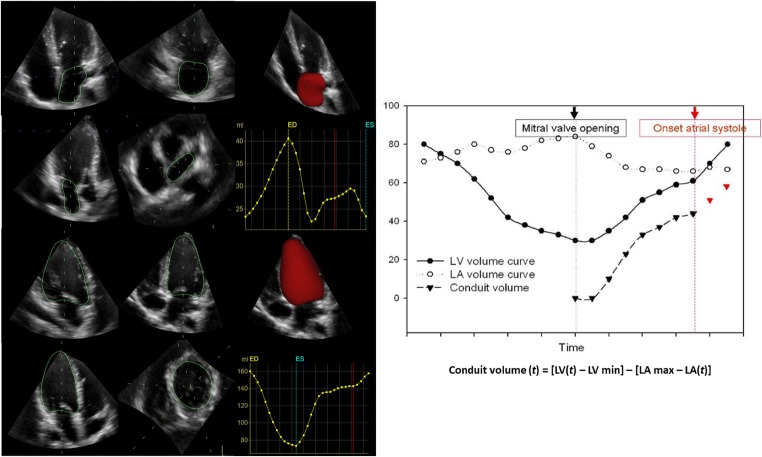
Fig. 2.
Left atrial conduit volume quantification by 3D echocardiography. Left, single-beat simultaneous left atrial (LA)–left ventricular (LV) pyramidal 3D echocardiographic full-volume dataset as obtained from the apex in a given patient, using the 4V transducer during held respiration (frame rate > 16.5/s).The volume data are displayed in real time, three apical views and one cross-sectional slice, with optional volume-rendering techniques for visualisation of valves and structures. Right, conduit volume is quantified according to the formula: (LV at time (t) minus LV minimum) minus (LA maximal minus LA at time (t)), integrating volume data from minimum LV volume to the beginning of LA contraction (as identified from simultaneously acquired ECG signal) and expressed as percent of LV stroke volume

