
Fig. 16.
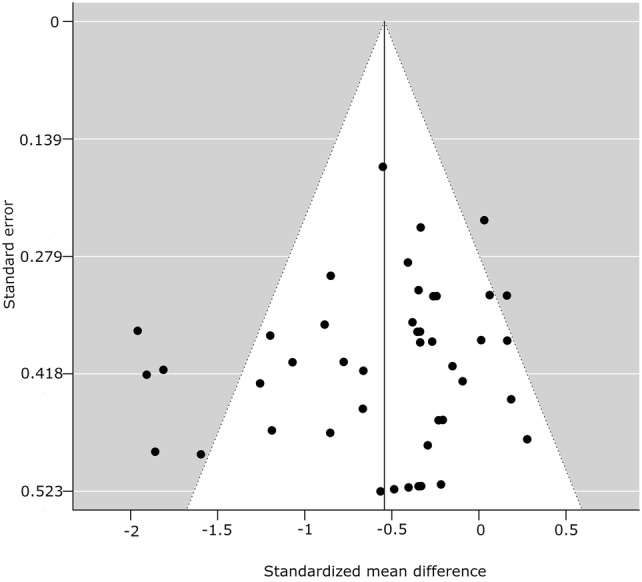
Funnel plot for glucose measures, random-effects model: physical activity breaks versus sitting. A filled circle represents a study; an empty circle, if present, represents a “missing” study by the trim and fill method
Official websites use .gov
A
.gov website belongs to an official
government organization in the United States.
Secure .gov websites use HTTPS
A lock (
) or https:// means you've safely
connected to the .gov website. Share sensitive
information only on official, secure websites.
Funnel plot for glucose measures, random-effects model: physical activity breaks versus sitting. A filled circle represents a study; an empty circle, if present, represents a “missing” study by the trim and fill method