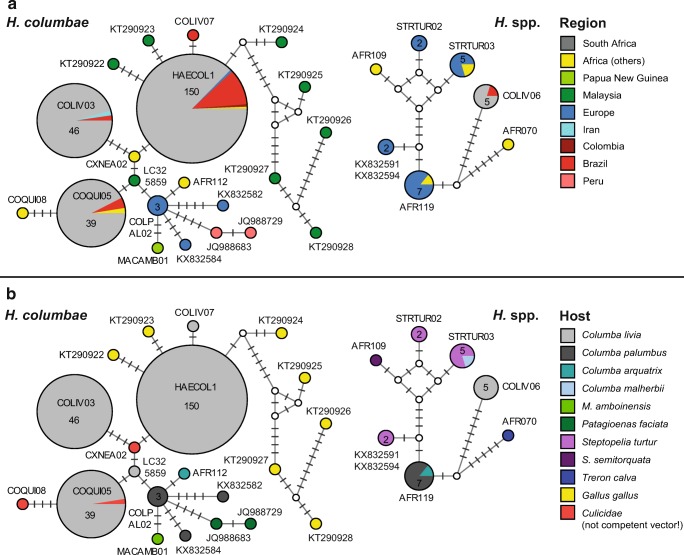
Fig. 1.
Median-joining haplotype networks of cytb sequences (476-bp) from the present study and GenBank. The size of the circles corresponds to the number of identical haplotypes. Bars on branches connecting the circles indicate the number of differences (substitutions) between haplotypes. Small white circles indicate median vectors. If available, the MalAvi lineage names are provided for each haplotype. Networks on the left side show haplotypes of H. columbae and related lineages, and networks on the right side show haplotypes of Haemoproteus spp. (COLIV06) and related lineages. a Information on host species. b Geographic distribution

