
Fig. 2.
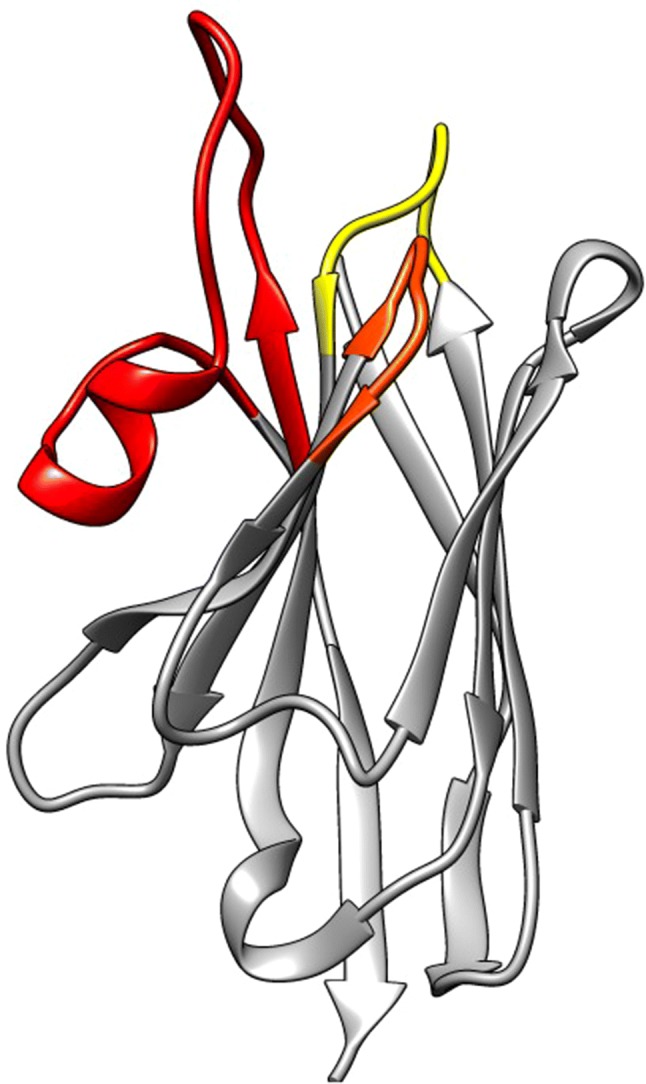
Ribbon representation of a nanobody (pdb 1JTT). The framework regions are in grey, the hypervariable H1, H2 and H3 antigen binding loops are in yellow, orange and red, respectively
Official websites use .gov
A
.gov website belongs to an official
government organization in the United States.
Secure .gov websites use HTTPS
A lock (
) or https:// means you've safely
connected to the .gov website. Share sensitive
information only on official, secure websites.
Ribbon representation of a nanobody (pdb 1JTT). The framework regions are in grey, the hypervariable H1, H2 and H3 antigen binding loops are in yellow, orange and red, respectively