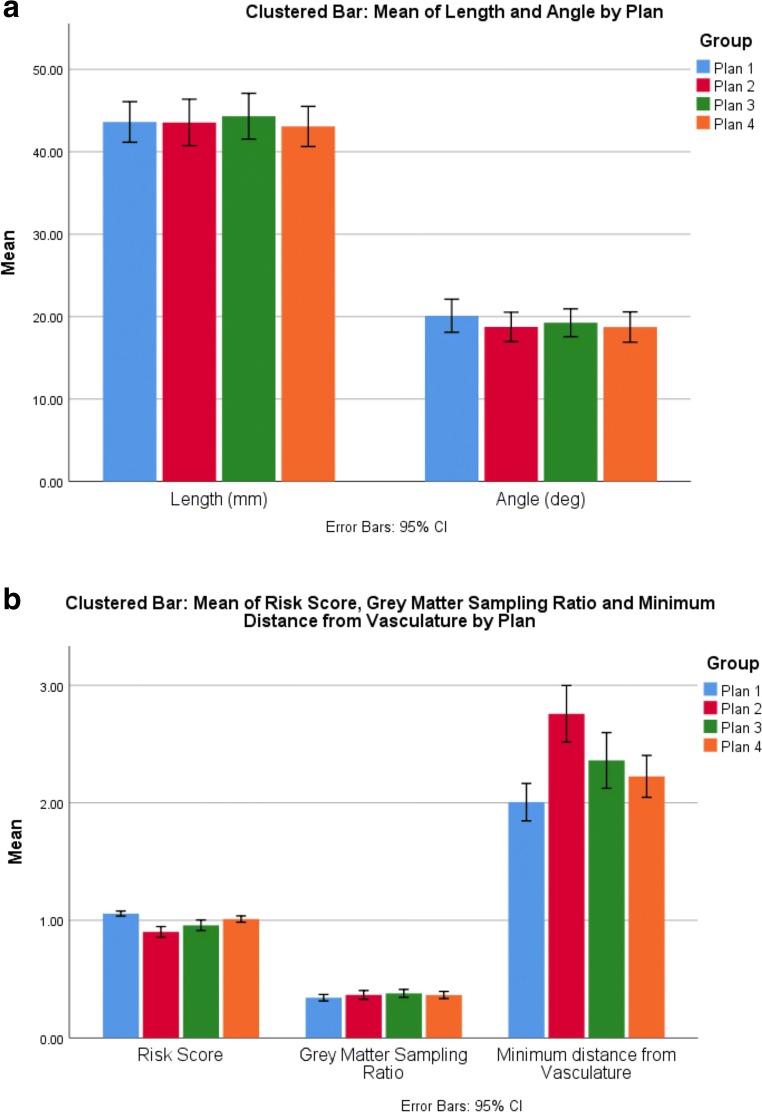
Fig. 4.
Comparative trajectory metrics between plans: a comparison of mean length (mm) and drilling angle to the skull (deg.) and b risk score, gray matter sampling ratio, and minimum distance from vasculature (mm) between the different trajectory generation methods (plans 1–4). Error bars represent 95% confidence intervals

