FIGURE 5.

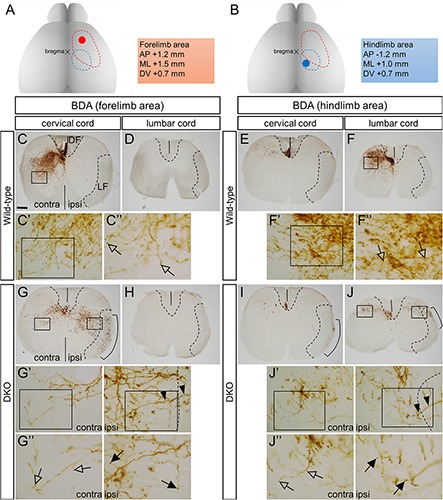
Projection of BDA-labeled CST fibers in the spinal cord. (A,B) BDA injection sites for the forelimb (A) and hindlimb (B) areas. The red and blue dotted lines encompass the forelimb and hindlimb areas, respectively. Stereotaxic coordinates for representative injection sites (red and blue spots) are shown on the right. (C–J) Images of the transverse sections of the cervical and lumbar spinal cord regions of the wild-type (C–F) and Sulf1/2 DKO mice (G–J) are shown. The dashed lines delineate the borders of the dorsal funiculus (DF) and ipsilateral lateral funiculus (LF). The solid lines indicate the midline. (C′,C″,F′,F″,G′,G″,J′,J″) Show the magnified pictures of the boxed area in (C,C′,F,F′,G,G′,J,J′), respectively. In the wild-type mouse, the labeled CST fibers that descended in the contralateral DF projected to the dorsal horn and intermediate zone (C,F) and formed terminal arbors with bouton-like structures (C″,F″; open arrows). In the Sulf1/2 DKO mouse, the labeled CST fibers descended in both the contralateral DF and the ipsilateral LF (G,I,J) and projected bilaterally in the gray matter (G,J). The terminal arbors in both the contralateral (open arrows) and the ipsilateral gray matter (filled arrows) showed bouton-like structures (G″,J″). The arrowheads in (G′) and (J′) show the fibers that entered the gray matter from the ipsilateral LF. The scale bar indicates 200 μm (C–J), 35 μm (C′,F′,G′,J′), and 20 μm (C″,F″,G″,J″).
