FIGURE 6.

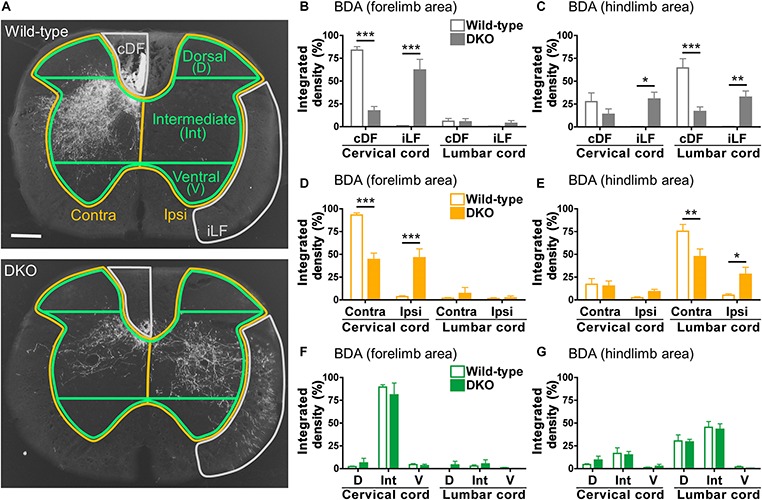
Quantitation of the BDA-labeled CST fibers in the spinal cord. (A) Regions of interest (ROIs) for quantifying the BDA-labeled fibers. The ROIs for the contralateral dorsal funiculus (cDF) and ipsilateral lateral funiculus (iLF) (outlined by gray lines); contralateral (Contra) and ipsilateral (Ipsi) gray matter (outlined by orange lines); and dorsal (D), intermediate (Int), and ventral (V) gray matter (outlined by green lines) are shown. Representative images of the cervical spinal cord from wild-type and Sulf1/2 DKO mice that received BDA injection in the forelimb area (the same as the ones shown in Figures 5C,G) are shown. The scale bar indicates 200 μm. (B–G) The integrated density, the sum of the values of the signals above the threshold, was measured for each ROI, and its rate to the sum of the integrated density in all the ROIs analyzed in the cervical and lumbar spinal cord regions is shown as a percentage. The percent integrated density of the BDA signals after injection into the forelimb (B,D,F) and hindlimb (C,E,G) areas in the wild-type (n = 6) and DKO (n = 6) mice is plotted. In (F,G), the integrated densities on both sides are combined and analyzed. Data shown are means ± SEMs. Statistical significance was calculated using two-way ANOVA with a Bonferroni post hoc test (∗P < 0.05, ∗∗P < 0.01, ∗∗∗P < 0.001).
