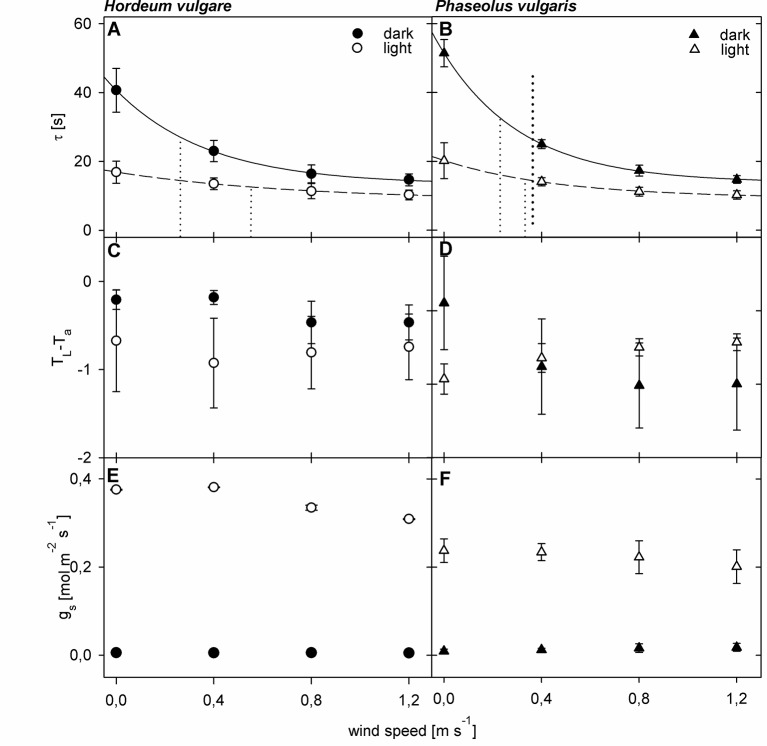
Figure 2.
Wind- and light-induced changes in leaf heat transfer parameters of spring barley (Hordeum vulgare) and common bean (Phaseolus vulgaris). Measurements of dark-adapted leaves are indicated by closed symbols, and measurements of light-adapted leaves are indicated by open symbols. (A, B) Wind- and light induced changes in time constant (τ). Dotted lines represent the wind speed at which τ has decreased to 50% of its initial value (u0.5) (C, D) Wind- and light-induced changes in difference between leaf temperature and ambient air temperature (TL-Ta). (E, F) Wind- and light-induced changes in stomatal conductance (gs). Error bars indicate standard deviation. For barley plants n = 9 individual leaves, for bean n = 10 individual leaves.

