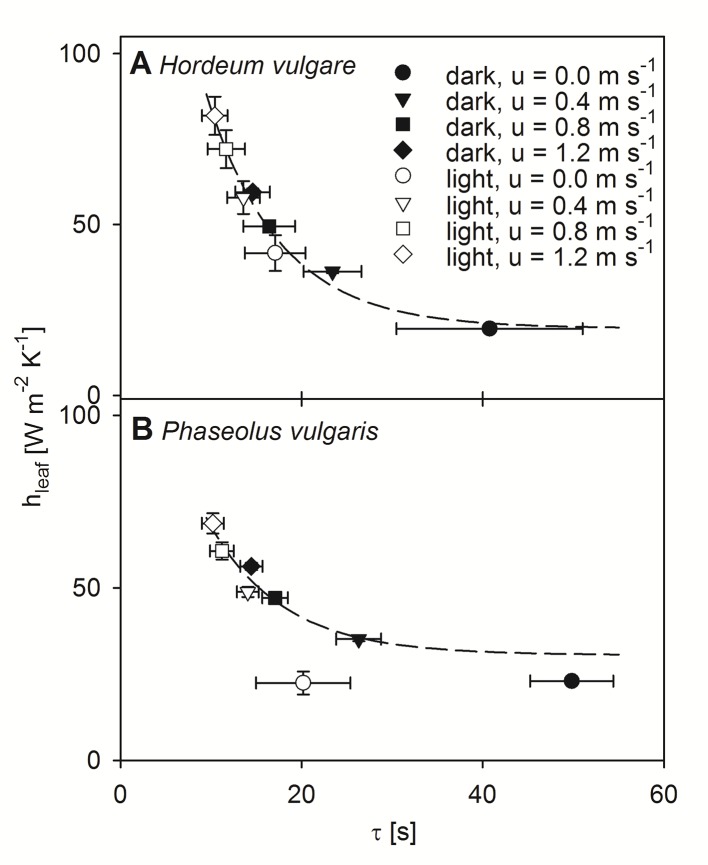
Figure 5.
Correlation between modeled leaf heat transfer coefficient (hleaf) and time constant (τ). Measurements were performed at four different wind speeds and in dark- (closed symbols) and light-adapted (open symbols) state of individual leaves. Measurement at a wind speeds of 0.0 m s-1 shown by circles, 0.4 m s-1 shown by triangles, 0.8 m s-1 shown by squares, and 1.2 m s-1 shown by diamonds. Dark-adapted leaves are indicated by closed symbols and light-adapted leaves are indicated by open symbols. (A) Measurements of individual spring barley leaves (Hordeum vulgare). Exponential regression indicated by dashed line: f(x) = 19.60 + 221.81 e-0.12x, r² = 0.97. (B) Measurements of individual common bean leaves (Phaseolus vulgaris). Exponential regression are indicated by a dashed line: f(x) = 30.56 + 128.29 e-0.12x, r² = 0.89. Error bars represent standard deviation of single leaves. For barley n = 9, and for bean n = 10.

