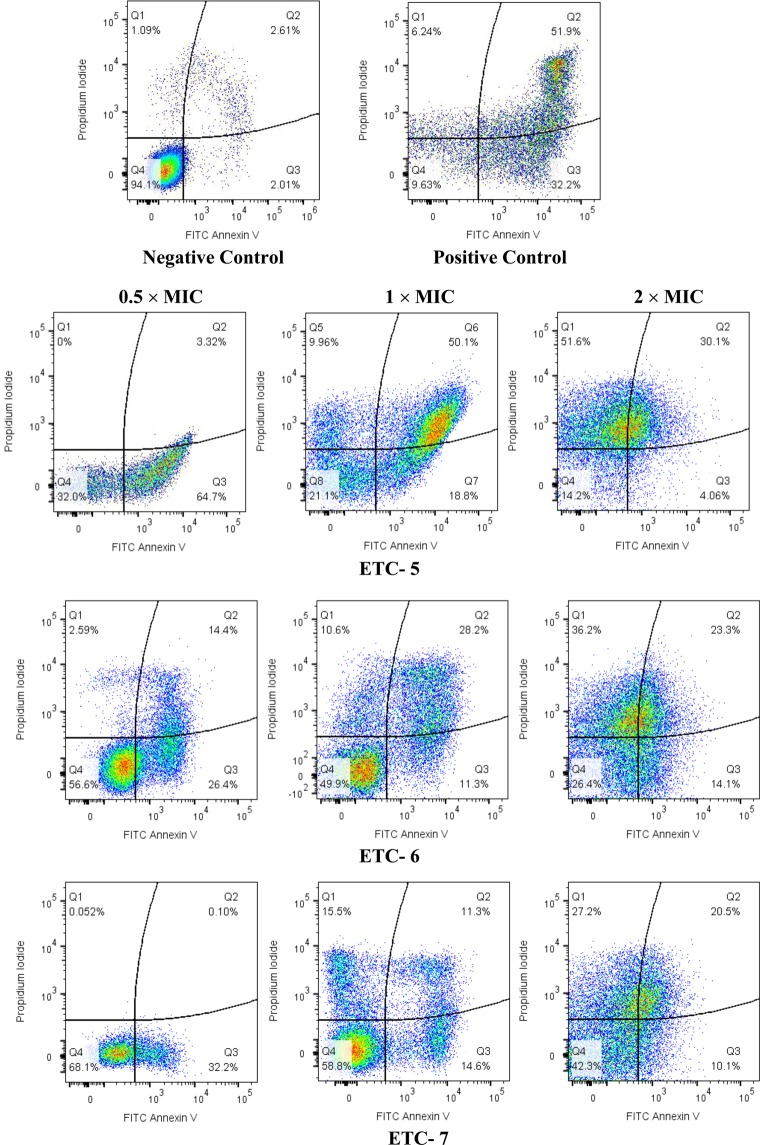
Figure 2.
Cell apoptosis measured by flowcytometry using annexin V-FITC and PI double staining. C. albicans SC5314 cells were exposed to varying concentrations of test compounds (ETC-5, ETC-6 and ETC-7). Untreated cells and cells exposed to H2O2 (250 μmol/L) were used as negative and positive controls respectively. In each density plot quadrant Q1: shows necrotic cells (annexin− PI+); Q2: late apoptotic cells (annexin+ PI+); Q3: early apoptotic cells (annexin+ PI−) and Q4: shows viable cells (annexin− PI−).

