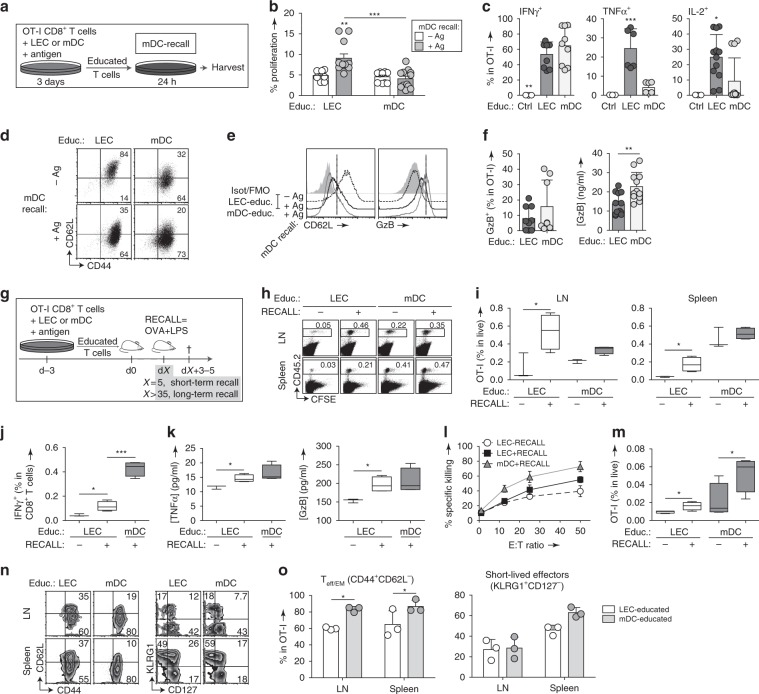
Fig. 7. LEC-educated CD8+ T cells expand rapidly and differentiate into effector cells upon secondary challenge.
a Experimental setup for b–f: CFSE-labeled LEC/mDC-educated cells were recalled with Ag-pulsed or control mDCs. b Percentage of CD8+ T cells that were proliferating at endpoint. c Frequency of IFNγ+, TNFα+, and IL-2+ cells among live OT-I cells. d Representative dot plots depicting CD62L and CD44 expression gated on OT-I cells depending on initial education conditions and antigen recall, and e according histograms depicting CD62L and GzB expression. f Frequency of intracellular GzB+ OT-I cells and production of GzB detected by ELISA in cell culture supernatants. g Experimental setup for h–o: CFSE-labeled CD45.2+ LEC/mDC-educated OT-I cells were transferred into CD45.1+ wild-type adult mice, and recalled with OVA/LPS at the short-term (5 days post-transfer, h–l) or long-term (>5 weeks post-transfer, m–o) memory phases. As a negative control, some recipients received a mock buffer injection (RECALL: −). h CFSE dilution on transferred cells recovered from LNs or spleens. i Composition of transferred cells among all live cells in the LNs or spleen. j Frequency of intracellular IFNγ+ cells among transferred cells. k Endpoint concentrations of TNFα and GzB production after ex vivo re-stimulation. l Cytotoxicity of recalled LEC-educated vs. mDC-educated OT-I cells measured based on specific killing of antigen-pulsed target cells relative to non-specific killing of scrambled peptide-pulsed target cells. E:T = effector to target cell ratio. m Composition of OT-I cells among live cells in the LNs after long-term recall. n Representative flow cytometry plots depicting expression of CD44, CD62L, CD127, and KLRG1 gated on OT-I cells. o Frequency of Teff/EM (CD44+CD62L−) and short-lived effectors (KLRG1+CD127−) within OT-I cells. Data points and error bars indicate mean ± SD for n = 3–7 biological replicates pooled from up to three independent experiments. Whiskers: Min to Max, median i–k, m. *p ≤ 0.05, **p ≤ 0.01, ***p ≤ 0.001 by two-way ANOVA b, l, o, one-way ANOVA with Bonferroni’s post-test c, or by two-tailed unpaired Student’s t-test f, i–k, m.

