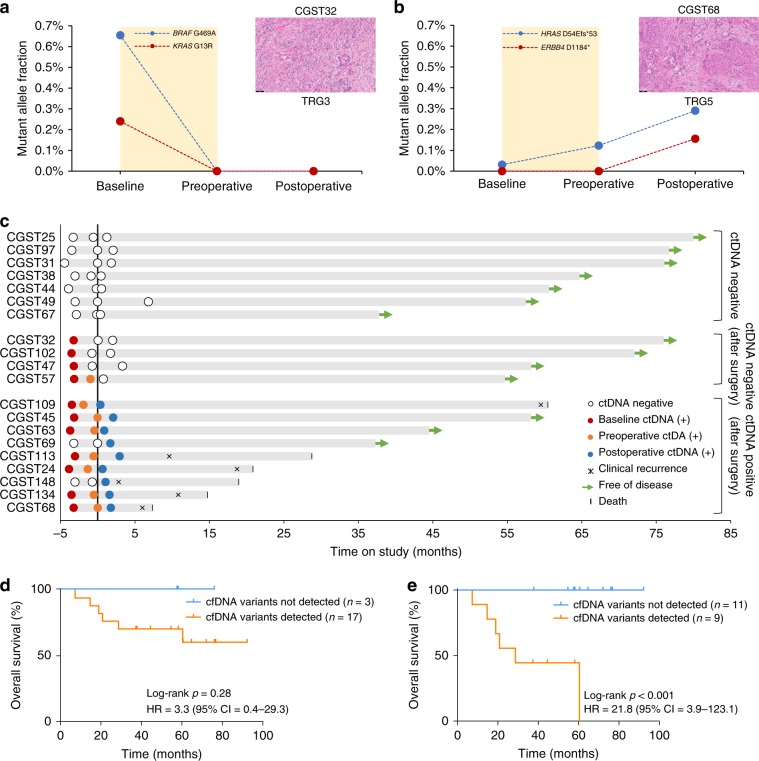
Fig. 4. Assessment of ctDNA as a minimal residual disease biomarker in resectable gastric cancer.
Levels of ctDNA variants at baseline, preoperative, and postoperative timepoints in a molecular responder (CGST32) (a) and in a non-responder (CGST68) (b). Variant MAFs in the molecular responder show elimination of ctDNA, while ctDNA levels continue to rise in the molecular non-responder. A representative H&E image (×20 magnification) depicting Mandard’s tumor regression grade is shown for each case on the right. Longitudinal representation of ctDNA results from 20 patients with a postoperative timepoint available. Black vertical line represents the time of surgery. Green arrows depict patients with no evidence of disease at last follow-up (c). Kaplan–Meier estimates for overall survival of patients with detected vs. not detected variants at the postoperative timepoint using all cfDNA sequence changes (log-rank p = 0.28; HR = 3.3; 95% CI = 0.4–29) (d) or using only ctDNA alterations identified from the WBC-filtered approach (log-rank p = 0.001; HR = 21.8; 95% CI = 3.9–123.1) (e).

