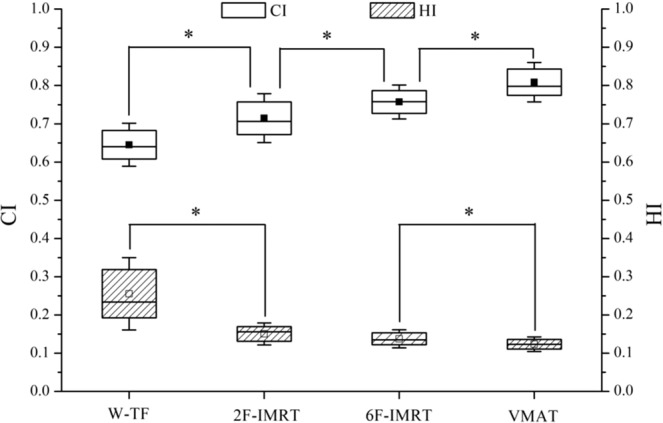
Figure 2.

Statistical comparison of conformity index (CI) and homogeneity index (HI) for the PTV in four treatment plans. The midline shows the median; the box covers the 25th to the 75th percentile of the group; the whiskers depict the range of values for standard deviation; a square with or without black fill indicates the mean value. *Indicates a statistically significant difference. W-TF = 3D-CRT with two tangential fields and wedges; 2F-IMRT = IMRT with two tangential fields; 6F-IMRT = IMRT with six fields; and VMAT = VMAT with double partial arcs.
