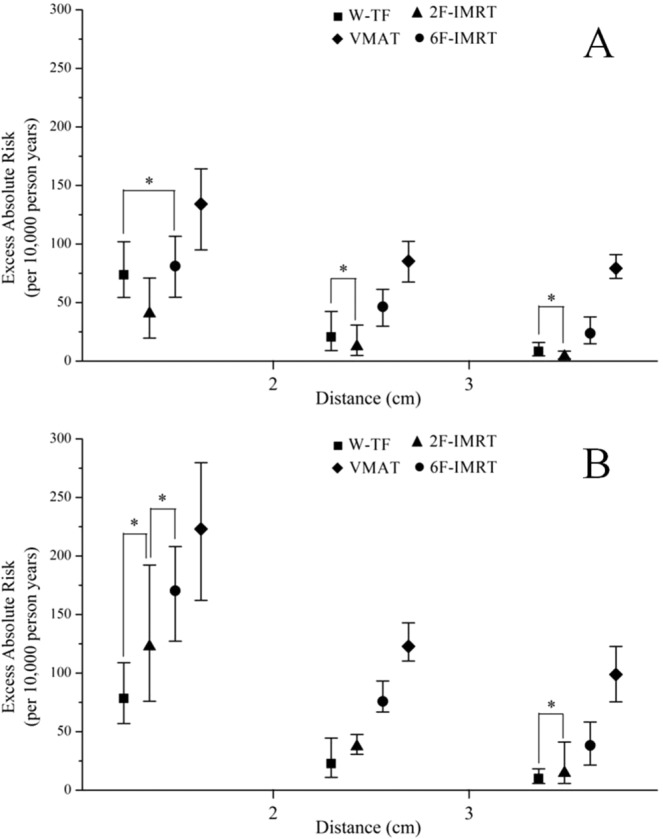
Figure 7.

The summation of the excess absolute risks for the contralateral breast (CB) and contralateral lung (CL) obtained at different distances after pre- and post-simulated setup error for all alternative techniques (A for pre-simulation and B for post-simulation). The data were derived from the full mechanistic dose-response model. The geometric symbols show the mean values; the whiskers depict the range of values for minimum and maximum; *indicates no statistically significant difference. W-TF = 3D-CRT with two tangential fields and wedges; 2F-IMRT = IMRT with two tangential fields; 6F-IMRT = IMRT with six fields,; and VMAT = VMAT with double partial arcs.
