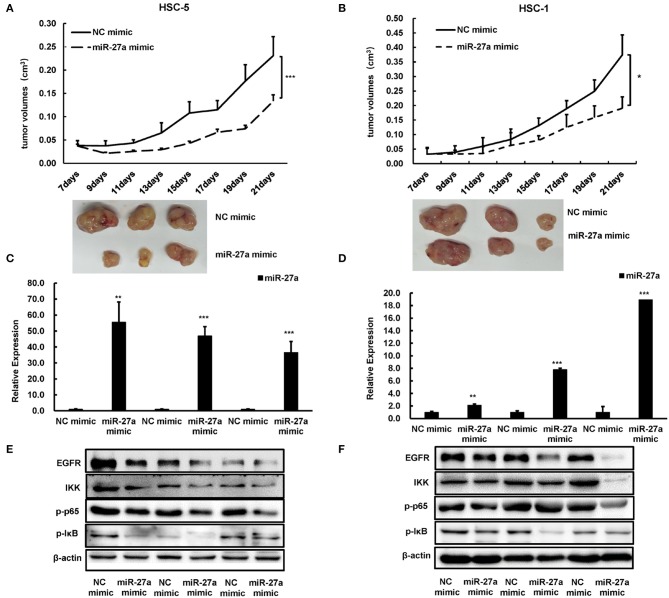
Figure 5.
miR-27a inhibited tumor growth of cSCC in vivo. (A,B) Growth curves of tumor volumes in miR-27a mimic group and NC mimic group were determined every 3 days. Representative photographs of tumors were shown below. (C,D) Relative expression of miR-27a in HSC-5 cells treated with miR-27a mimic or negative control. (E,F) miR-27a overexpression regulated the phosphorylation of EGFR and the phosphorylation of p65, IκB, and IKK. Each experiment was performed in triplicate and data are presented as mean ± s.d. One-Way ANOVA and Dunnett's Multiple comparison test were used to analyze the data (*P < 0.05, **P<0.01, ***P <0.001).

