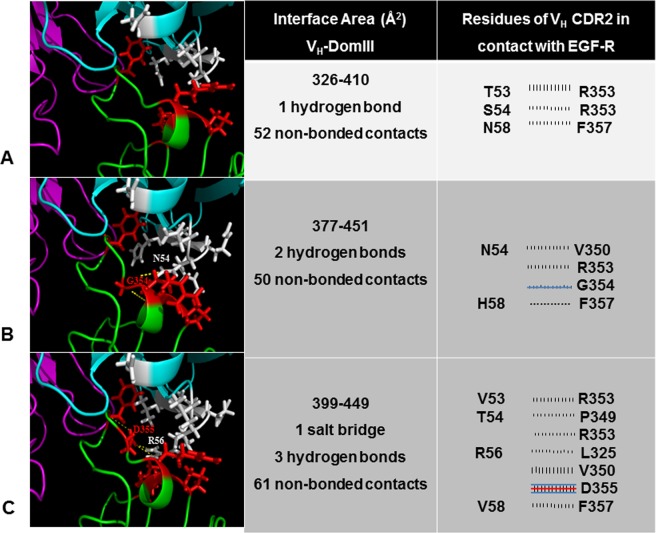
Figure 4.
In silico analysis of the in vitro evolved interaction interfaces between antibodies and EGF receptor. Cartoon representations of nimotuzumab (A), K4 mAb (B) and K5 mAb (C) in complex with the antigen are shown in the left panel. The model structure of the original complex between nimotuzumab and EGF-R had been obtained from docking studies.17Models of the complexes between the antigen and the mutated antibodies (K4/K5) were generated by introducing the required amino acid replacements in the previous model and refining the structures. The images are centered in the interface region that involves VH CDR2 residues (the segment that accumulated mutations as a result of in vitro affinity maturation). Heavy and light chains, and EGF-R, are colored cyan, magenta and green, respectively. Side chains of VH CDR2 residues that were mutated in the current study (positions 53–58) are represented with white sticks. Side chains of EGF-R in contact with VH CDR2 (<4Ǻ) are represented as red sticks. Hydrogen bonds and salt bridges are shown with yellow dotted lines. The pictures were generated with Pymol. The central panel shows the calculated contact areas between VH (left number) and EGF-R domain III (right number), as well as the number of predicted interactions between them, according to the analysis with the program PDBsum implemented in an online server (http://www.ebi.ac.uk/pdbsum). Details of such interactions (only those involving VH CDR2 residues targeted by mutagenesis) are represented in the right panel. Each line means an interaction between one residue in the antibody (left column) and another amino acid in the antigen (right column). Blue and red lines represent hydrogen bonds and salt bridges, respectively. Striped lines correspond to non-bonded interactions, the width of the striped line is proportional to the number of atomic contacts.

