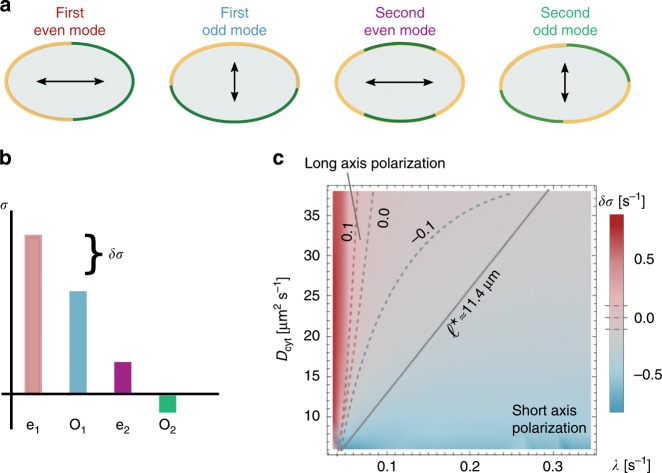
Fig. 3. Mode selection and polarity.
a Illustration of the protein distribution on the membrane and the ensuing polarity axis for the lowest-order even and odd modes. b Illustration of the mode spectrum for these lowest-order modes and the gap δσ in the growth rates between the first even and odd modes. c Relative difference in the growth rates of the first even and odd modes (linear stability analysis in colour code with dashed threshold lines δσ = 0 s−1, δσ = ±0.1 s−1), δσ, as a function of Dcyt and λ. For small λ and large Dcyt, δσ is clearly greater than zero (red, long-axis polarisation), whereas for large λ and small Dcyt, δσ lies below zero (blue, short-axis polarisation). These findings are validated using FEM simulations. FEM sweeps in Dcyt and λ were run until the steady state was reached. These simulations yielded a straight-line interface (black-solid line in (c)) in the λ-Dcyt parameter space which divides long- (above) from short-axis (below) polarisation in steady state. The line corresponds to a constant threshold reactivation length ℓ⋆. All other parameters can be found in Table 1.

