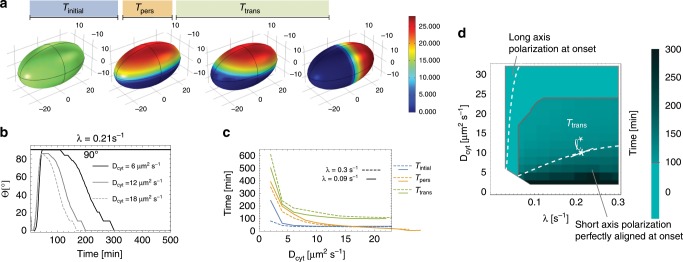
Fig. 6. Cell polarisation in three dimensions.
a Image series from FEM (Comsol) simulation for Dcyt = 6 μm2 s−1, and reactivation rate λ = 0.21 s−1. The series illustrates the different times which are further analysed: the time from the initial aPAR-dominated unpolarised state to the initial short-axis polarisation, Tinitial; the time duration of persistent short-axis polarisation, Tpers; and the time the pattern takes to turn from short- to long-axis polarisation, Ttrans. b The angle Θ of the concentration maximum of membrane-bound A1 is plotted against simulation time for different Dcyt indicated in the graph. c Tinitial, Tpers, Ttrans plotted as a function of Dcyt for λ = 0.09 s−1 and λ = 0.3 s−1. d The magnitude of the transition time from short- to long-axis polarisation, Ttrans, in Dcyt-λ parameter space; a cell was considered to be polarised along the short axis if 90° − 10° ≤ Θ ≤ 90° + 10°. The monochrome cyan-coloured region above the grey line corresponds to a parameter region where there is no short-axis polarisation, but the polarisation axis is aligned along the diagonal or long axis from the beginning. The dashed lines demarcate parameter regimes where the initial polarisation is aligned perfectly with the short axis (Θ = 90°) or with the long axis, as indicated in the graph.

