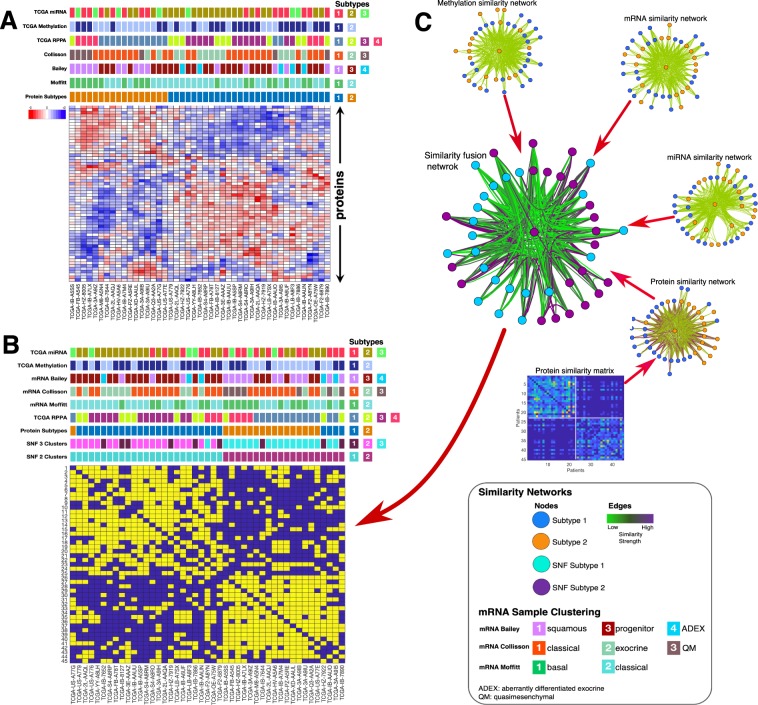
Figure 1.
Classification of pancreatic cancer: (A) Comparison between the proteomics-based subtyping of pancreatic cancers using unsupervised hierarchical clustering, to other classification schemes from top to bottom: TCGA’s (Raphael et al., 2017) miRNA, RPPA, and DNA methylation; mRNA-based classification schemes using the gene biomarkers established by Collosson et al.; Bailey et al.; and Moffitt et al. (B) Illustrative example of SNF steps: similarity matrices are used to create patient networks from protein, mRNA, miRNA and DNA methylation data showing patient-to-patient similarities for the 45 pancreatic cancer patients. The network nodes represent patients. The colours of edges joining nodes indicate the degree of similarity between pairs of patients. The nodes of the fused network are coloured according to the subtypes to which the patient tumours were assigned using spectral clustering of the combined patient network. (C) Comparison between the SNF subtyping using spectral clustering to other classification schemes from top to bottom: TCGA’s14 miRNA, and DNA methylation classifications; mRNA-based classification schemes8,48; TCGA’s RPPA classification, our K-means clustering classification; our 3-cluster SNF classification; and our 2-clusters SNF classification.

