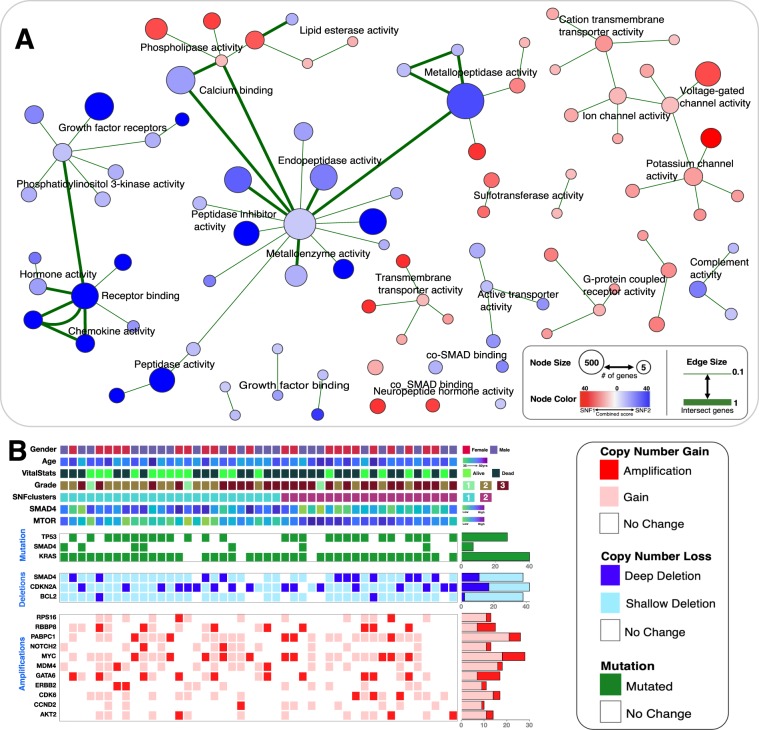
Figure 4.
(A) Network of Gene Ontology (GO) molecular functions found enriched between the two pancreatic cancer subtypes. Enrichr was used to obtain enriched GO-terms that were visualised in Cytoscape (refer to the methods section). Each node represents a GO-term with similar nodes clustered together and connected by edges with the number of shared genes between the nodes being represented by the thickness of the edges. The size of each node denotes the gene set size of the represented GO-term. The colour of each node represents the magnitude of the combined enrichment score: red represent enrichment in subtype-1 tumours and blue represents enrichment in subtype-2 tumours. (B) The integrated plot of clinical and molecular features of 45 tumour samples ordered by their SNF clustering positions. From top to bottom panels indicate: patient gender; Age at which a condition or disease was first diagnosed; neoplasm histological grade; SNF subtype of tumour; SMAD4 protein expression level; mTOR protein expression level; significantly mutated genes: TP53, SMAD4 and KRAS gene mutations; SMAD4, CDKN2A and BCL2 gene deep deletion (dark blue) and shallow deletion (pale blue); gene amplification (red) and copy number gain (pink) of multiple genes.

