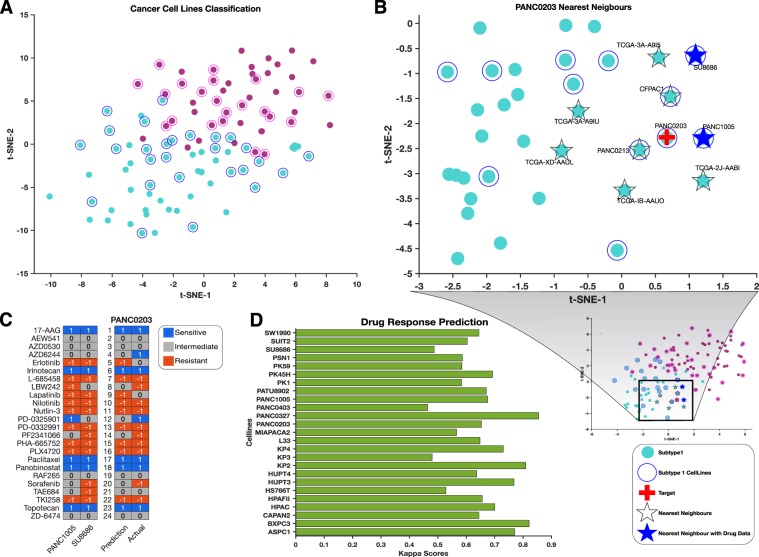
Figure 6.
(A) Supervised classification of CCLE pancreatic cancer cell lines using the mRNA-based KNN-model trained on TCGA data. t-SNE was used to visualise the tumour classes using the exact algorithm and squared Euclidean distance metric. Circled points represent classified CCLE cell lines, whereas un-circled points represent the TCGA samples used to train the models. (B) The t-SNE plot represents the KNN search for the nearest neighbours of PANC0203 in the exhaustive searcher model. Refer to the legend at the right bottom of the figure for interpretation. (C) Drug response prediction: first two lanes represent the ranked drug responses to the 24 anticancer drugs of the PANC0203 nearest neighbours (PANC1005 and SU8686) for which such data is available. The last two lanes represent PANC0203’s predicted drug responses and its actual drug responses. (D) Kappa scores of all CCLE pancreatic cancer cell lines with drug data. The kappa score was calculated using the quadratic method by comparing the actual and predicted drug responses of cell lines to the 24 CCLE anticancer.

