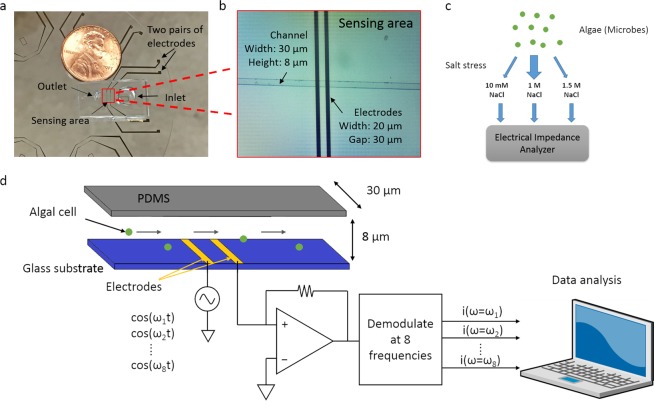
Figure 1.
Overview of strategy. (a) Image of the device whereby a soft-lithography made PDMS microfluidic channel is bound onto a glass wafer patterned with two pairs of sensing electrodes. (b) Microscope image of the channel and electrodes. (c) Diagram showing the experimental design of the cell impedance experiments in which Picochlorum SE3 cells were cultured under widely different salinity conditions (10 mM, 1.5 M NaCl) after being acclimated to 1 M NaCl, and sampled at 4 different time points (1 h, 5 h, 1 d, and 5 d). After culturing, all cells were washed three times in PBS buffer and injected into the electrical impedance analyzer to collect the data. (d) Schematic diagram of the electrical impedance measurement. Algal cells were introduced into the channel from the inlet well. When cells flowed through the sensing region, they blocked part of the ions conducting current between the two electrodes. As a result, the impedance changed in this region. This change was captured by a lock-in amplifier at eight different frequencies. The data were transferred to the attached computer for downstream analysis.

