Figure 5.
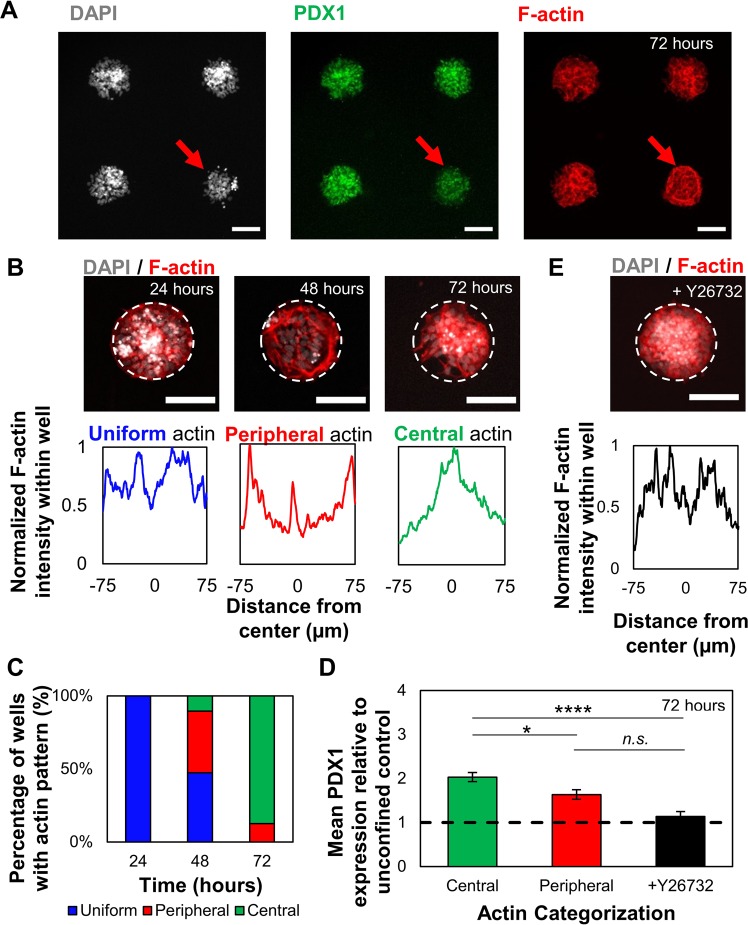
Confined culture promotes temporal changes in F-actin organization during differentiation. (A) Micropatterned iPSC-derived PF cell colonies that show visibly lower PDX1 intensity (red arrows) are correlated with distinct actin cytoskeleton structures concentrated at the microwell periphery. (B) Characteristic actin structures found throughout 72 hours of differentiation in 150 µm microwells. These structures are grouped based on actin intensity analysis (bottom). The reported intensity profile is obtained from an average of 8 intersecting lines (Fig. S6). (C) Proportion of wells with actin structure (classified in (B) at 24 (n = 10), 48 (n = 19), and 72 (n = 32) hours. Distribution of actin structures changes throughout differentiation and aggregates towards the center in 150 µm microwells. (D) PF colonies in 150 µm microwells with central actin distribution (n = 16) showed increased nuclear PDX1 expression compared to those with peripheral actin distribution (n = 5). Addition of Y-26732 abrogated any increase in nuclear PDX1 expression compared to the unconfined control (n = 12). (E) Addition of Y-26732 ROCK inhibitor 24 hours after seeding prevents actin structural reorganization. *p < 0.05, ****p < 0.001 for the student’s t-test. Scale bars: 100 µm.

