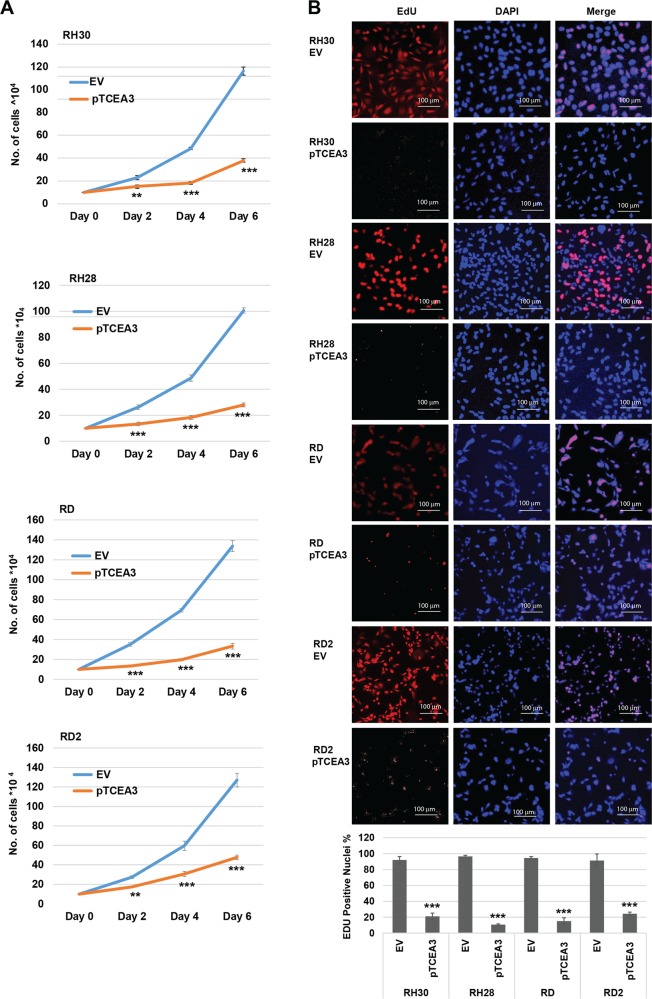
Fig. 4. TCEA3 expression inhibits RMS cell line proliferation.
a RMS cells stably expressing TCEA3 or the vector control (EV) were seeded at the same number of cells and harvested for cell counts every 2 days. b Proliferation of RMS cells expressing TCEA3 was assayed by an EdU cell proliferation assay. Blue (DAPI) represents nuclei, and red represents EdU labeled nuclei, which labels cells undergoing DNA synthesis (S phase) during the time window of EdU treatment. Scale bar is 100 µm. EdU positive nuclei were counted in at least five random fields in microscopic images and percentage was calculated in comparison to total nuclei in the same images. Error bars are S.E.M. Student's t test; **p < 0.01, ***p < 0.001 with respect to EV, n ≥ 3 biological replicates except proliferation assay (n = 2).

