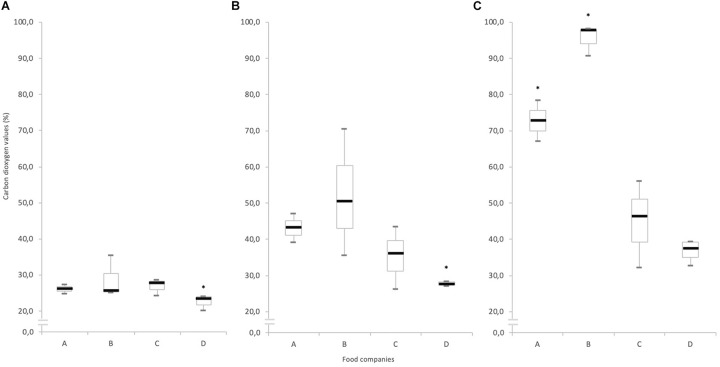
FIGURE 1.
Box plots show the carbon dioxide measurements at the end of the shelf life, for the four food companies (A–D) at (A) 2°C, (B) 8°C, and (C) 12°C. The boxes represent the interquartile range between the first (Q1) and the third (Q3) quartiles; the vertical black line insides the box is the median obtained from the three batches analyzed by food industries; the two dotted line is the difference of 25% below the Q1 or above the Q3. The presence of stars indicated that samples deviated significantly from the carbon dioxide value at day 0 (30.0 ± 0.1%).

