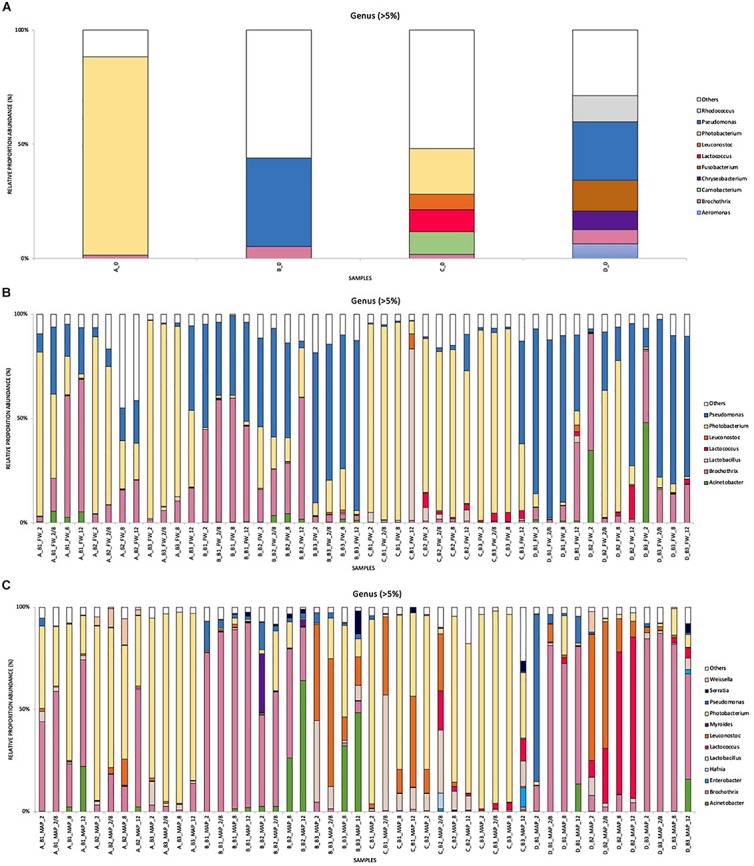
FIGURE 3.

Cumulated histograms of the relative abundance (%) of taxa and the dynamics of the bacterial community identified by metagenetics at Genus levels, during cold storage of minced pork meat in relation to the food packaging and the origin of samples (food companies and batches). (A) food samples analyzed at day 0 for the four companies (A–D), (B) storage in FW (food wrap) packaging, (C) storage in MAP (modified atmosphere) packaging. At Genus levels, the taxa representing <5% in relative abundance were merged in the category of “Others”. These data including the relative abundance of sequences are also summarized in Supplementary Tables S4–S6. Legend: batch 1 (B1), batch 2 (B2), batch 3 (B3), at 2°C (2), at 8°C (8), at 12°C (12), and for a third of the shelf life at 2°C and for the rest of the shelf life at 8°C (2/8).
